
Page 91 - A Guide to MATLAB for Beginners and Experienced Users
P. 91
72 Chapter 5: MATLAB Graphics
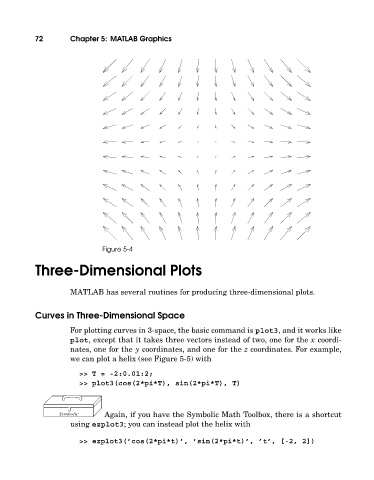
Figure 5-4
Three-Dimensional Plots
MATLAB has several routines for producing three-dimensional plots.
Curves in Three-Dimensional Space
For plotting curves in 3-space, the basic command is plot3, and it works like
plot, except that it takes three vectors instead of two, one for the x coordi-
nates, one for the y coordinates, and one for the z coordinates. For example,
we can plot a helix (see Figure 5-5) with
>> T = -2:0.01:2;
>> plot3(cos(2*pi*T), sin(2*pi*T), T)
Again, if you have the Symbolic Math Toolbox, there is a shortcut
using ezplot3; you can instead plot the helix with
>> ezplot3(’cos(2*pi*t)’, ’sin(2*pi*t)’, ’t’, [-2, 2])