Page 88 - A Guide to MATLAB for Beginners and Experienced Users
P. 88

Two-Dimensional Plots        69


           Contour Plots and Implicit Plots
                     A contour plot of a function of two variables is a plot of the level curves of the
                     function, that is, sets of points in the x-y plane where the function assumes
                                                                      2
                                                                           2
                     a constant value. For example, the level curves of x + y are circles centered
                     at the origin, and the levels are the squares of the radii of the circles. Contour
                     plots are produced in MATLAB with meshgrid and contour. The command
                     meshgrid produces a grid of points in a specified rectangular region, witha
                     specified spacing. This grid is used by contour to produce a contour plot in
                     the specified region.
                                                           2
                                                      2
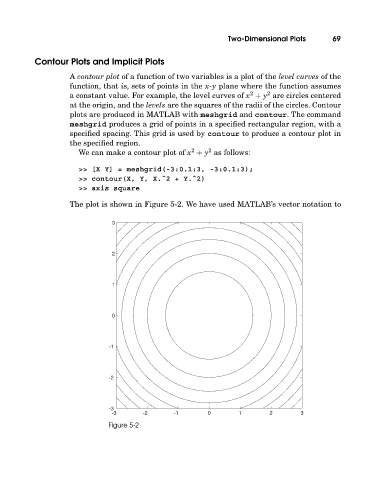
                       We can make a contour plot of x + y as follows:
                       >> [X Y] = meshgrid(-3:0.1:3, -3:0.1:3);
                       >> contour(X, Y, X.ˆ2 + Y.ˆ2)
                       >> axis square

                     The plot is shown in Figure 5-2. We have used MATLAB’s vector notation to

                                3


                                2


                                1


                                0


                               -1


                               -2


                               -3
                                -3       -2      -1       0        1       2        3
                               Figure 5-2
   83   84   85   86   87   88   89   90   91   92   93