
Page 89 - A Guide to MATLAB for Beginners and Experienced Users
P. 89
70 Chapter 5: MATLAB Graphics
produce a grid withspacing 0.1 in bothdirections. We have also used axis
square to force the same scale on both axes.
You can specify particular level sets by including an additional vector ar-
√ √
gument to contour. For example, to plot the circles of radii 1, 2, and 3,
type
>> contour(X, Y, X.ˆ2 + Y.ˆ2, [1 2 3])
The vector argument must contain at least two elements, so if you want
to plot a single level set, you must specify the same level twice. This is quite
useful for implicit plotting of a curve given by an equation in x and y.For
example, to plot the circle of radius 1 about the origin, type
>> contour(X, Y, X.ˆ2 + Y.ˆ2, [1 1])
2
2 2
2
2
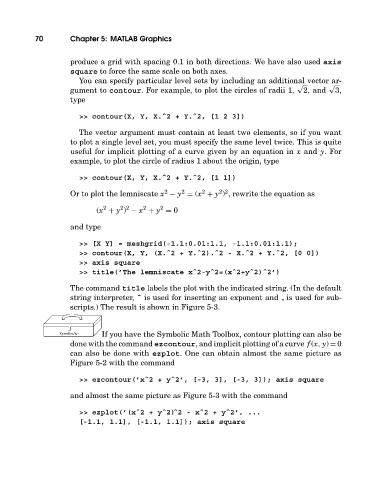
Or to plot the lemniscate x − y = (x + y ) , rewrite the equation as
2 2
2
2
2
(x + y ) − x + y = 0
and type
>> [X Y] = meshgrid(-1.1:0.01:1.1, -1.1:0.01:1.1);
>> contour(X, Y, (X.ˆ2 + Y.ˆ2).ˆ2 - X.ˆ2 + Y.ˆ2, [0 0])
>> axis square
>> title(’The lemniscate xˆ2-yˆ2=(xˆ2+yˆ2)ˆ2’)
The command title labels the plot with the indicated string. (In the default
string interpreter, ˆ is used for inserting an exponent and is used for sub-
scripts.) The result is shown in Figure 5-3.
If you have the Symbolic Math Toolbox, contour plotting can also be
done withthe command ezcontour, and implicit plotting of a curve f (x, y) = 0
can also be done with ezplot. One can obtain almost the same picture as
Figure 5-2 withthe command
>> ezcontour(’xˆ2 + yˆ2’, [-3, 3], [-3, 3]); axis square
and almost the same picture as Figure 5-3 with the command
>> ezplot(’(xˆ2 + yˆ2)ˆ2 - xˆ2 + yˆ2’, ...
[-1.1, 1.1], [-1.1, 1.1]); axis square