
Page 99 - Hybrid Enhanced Oil Recovery Using Smart Waterflooding
P. 99
CHAPTER 4 Hybrid Chemical EOR Using Low-Salinity and Smart Waterflood 91
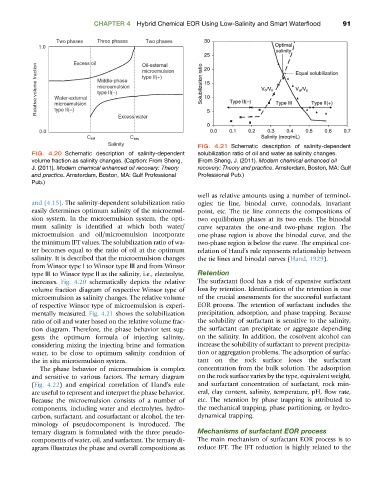
FIG. 4.21 Schematic description of salinity-dependent
FIG. 4.20 Schematic description of salinity-dependent solubilization ratio of oil and water as salinity changes.
volume fraction as salinity changes. (Caption: From Sheng, (From Sheng, J. (2011). Modern chemical enhanced oil
J. (2011). Modern chemical enhanced oil recovery: Theory recovery: Theory and practice. Amsterdam, Boston, MA: Gulf
and practice. Amsterdam, Boston, MA: Gulf Professional Professional Pub.)
Pub.)
well as relative amounts using a number of terminol-
and (4.15). The salinity-dependent solubilization ratio ogies: tie line, binodal curve, connodals, invariant
easily determines optimum salinity of the microemul- point, etc. The tie line connects the compositions of
sion system. In the microemulsion system, the opti- two equilibrium phases at its two ends. The binodal
mum salinity is identified at which both water/ curve separates the one-and two-phase region. The
microemulsion and oil/microemulsion incorporate one-phase region is above the binodal curve, and the
the minimum IFT values. The solubilization ratio of wa- two-phase region is below the curve. The empirical cor-
ter becomes equal to the ratio of oil at the optimum relation of Hand’s rule represents relationship between
salinity. It is described that the microemulsion changes the tie lines and binodal curves (Hand, 1929).
from Winsor type Ⅰ to Winsor type Ⅲ and from Winsor
type Ⅲ to Winsor type Ⅱ as the salinity, i.e., electrolyte, Retention
increases. Fig. 4.20 schematically depicts the relative The surfactant flood has a risk of expensive surfactant
volume fraction diagram of respective Winsor type of loss by retention. Identification of the retention is one
microemulsion as salinity changes. The relative volume of the crucial assessments for the successful surfactant
of respective Winsor type of microemulsion is experi- EOR process. The retention of surfactant includes the
mentally measured. Fig. 4.21 shows the solubilization precipitation, adsorption, and phase trapping. Because
ratio of oil and water based on the relative volume frac- the solubility of surfactant is sensitive to the salinity,
tion diagram. Therefore, the phase behavior test sug- the surfactant can precipitate or aggregate depending
gests the optimum formula of injecting salinity, on the salinity. In addition, the cosolvent alcohol can
considering mixing the injecting brine and formation increase the solubility of surfactant to prevent precipita-
water, to be close to optimum salinity condition of tion or aggregation problems. The adsorption of surfac-
the in situ microemulsion system. tant on the rock surface loses the surfactant
The phase behavior of microemulsion is complex concentration from the bulk solution. The adsorption
and sensitive to various factors. The ternary diagram on the rock surface varies by the type, equivalent weight,
(Fig. 4.22) and empirical correlation of Hand’s rule and surfactant concentration of surfactant, rock min-
are useful to represent and interpret the phase behavior. eral, clay content, salinity, temperature, pH, flow rate,
Because the microemulsion consists of a number of etc. The retention by phase trapping is attributed to
components, including water and electrolytes, hydro- the mechanical trapping, phase partitioning, or hydro-
carbon, surfactant, and cosurfactant or alcohol, the ter- dynamical trapping.
minology of pseudocomponent is introduced. The
ternary diagram is formulated with the three pseudo- Mechanisms of surfactant EOR process
components of water, oil, and surfactant. The ternary di- The main mechanism of surfactant EOR process is to
agram illustrates the phase and overall compositions as reduce IFT. The IFT reduction is highly related to the