
Page 104 - Hybrid Enhanced Oil Recovery Using Smart Waterflooding
P. 104
96 Hybrid Enhanced Oil Recovery using Smart Waterflooding
60 700 0.14
50 A, Ca/Na=0 600 0.12 A
Recovery factor (%OOIP) 40 B, Ca/Na=0.0175 400 Pressure drop (mbar) krw 0.08 LSS
B
500
0.10
C
C, (Ca+Mg)/Na=0.033
30
300
0.06
20
10 200 0.04 LSW
100
0.02
0 0 0.00
0 5 10 15 20
PV injected 0.0 0.2 0.4 0.6 0.8 1.0
SW
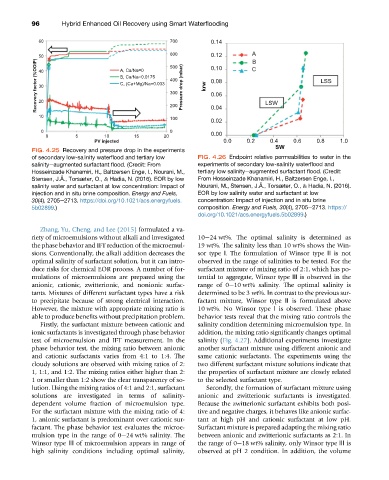
FIG. 4.25 Recovery and pressure drop in the experiments
of secondary low-salinity waterflood and tertiary low FIG. 4.26 Endpoint relative permeabilities to water in the
salinityeaugmented surfactant flood. (Credit: From experiments of secondary low-salinity waterflood and
Hosseinzade Khanamiri, H., Baltzersen Enge, I., Nourani, M., tertiary low salinityeaugmented surfactant flood. (Credit:
Stensen, J.Å., Torsæter, O., & Hadia, N. (2016). EOR by low From Hosseinzade Khanamiri, H., Baltzersen Enge, I.,
salinity water and surfactant at low concentration: Impact of Nourani, M., Stensen, J.Å., Torsæter, O., & Hadia, N. (2016).
injection and in situ brine composition. Energy and Fuels, EOR by low salinity water and surfactant at low
30(4), 2705e2713. https://doi.org/10.1021/acs.energyfuels. concentration: Impact of injection and in situ brine
5b02899.) composition. Energy and Fuels, 30(4), 2705e2713. https://
doi.org/10.1021/acs.energyfuels.5b02899.)
Zhang, Yu, Cheng, and Lee (2015) formulated a va-
riety of microemulsions without alkali and investigated 10e24 wt%. The optimal salinity is determined as
the phase behavior and IFT reduction of the microemul- 19 wt%. The salinity less than 10 wt% shows the Win-
sions. Conventionally, the alkali addition decreases the sor type Ⅰ. The formulation of Winsor type Ⅱ is not
optimal salinity of surfactant solution, but it can intro- observed in the range of salinities to be tested. For the
duce risks for chemical EOR process. A number of for- surfactant mixture of mixing ratio of 2:1, which has po-
mulations of microemulsions are prepared using the tential to aggregate, Winsor type Ⅲ is observed in the
anionic, cationic, zwitterionic, and nonionic surfac- range of 0e10 wt% salinity. The optimal salinity is
tants. Mixtures of different surfactant types have a risk determined to be 3 wt%. In contrast to the previous sur-
to precipitate because of strong electrical interaction. factant mixture, Winsor type Ⅱ is formulated above
However, the mixture with appropriate mixing ratio is 10 wt%. No Winsor type Ⅰ is observed. These phase
able to produce benefits without precipitation problem. behavior tests reveal that the mixing ratio controls the
Firstly, the surfactant mixture between cationic and salinity condition determining microemulsion type. In
ionic surfactants is investigated through phase behavior addition, the mixing ratio significantly changes optimal
test of microemulsion and IFT measurement. In the salinity (Fig. 4.27). Additional experiments investigate
phase behavior test, the mixing ratio between anionic another surfactant mixture using different anionic and
and cationic surfactants varies from 4:1 to 1:4. The same cationic surfactants. The experiments using the
cloudy solutions are observed with mixing ratios of 2: two different surfactant mixture solutions indicate that
1, 1:1, and 1:2. The mixing ratios either higher than 2: the properties of surfactant mixture are closely related
1 or smaller than 1:2 show the clear transparency of so- to the selected surfactant type.
lution. Using the mixing ratios of 4:1 and 2:1, surfactant Secondly, the formation of surfactant mixture using
solutions are investigated in terms of salinity- anionic and zwitterionic surfactants is investigated.
dependent volume fraction of microemulsion type. Because the zwitterionic surfactant exhibits both posi-
For the surfactant mixture with the mixing ratio of 4: tive and negative charges, it behaves like anionic surfac-
1, anionic surfactant is predominant over cationic sur- tant at high pH and cationic surfactant at low pH.
factant. The phase behavior test evaluates the microe- Surfactant mixture is prepared adapting the mixing ratio
mulsion type in the range of 0e24 wt% salinity. The between anionic and zwitterionic surfactants as 2:1. In
Winsor type Ⅲ of microemulsion appears in range of the range of 0e18 wt% salinity, only Winsor type Ⅲ is
high salinity conditions including optimal salinity, observed at pH 2 condition. In addition, the volume