
Page 126 - A Practical Companion to Reservoir Stimulation
P. 126
DIVERSION AND TREATMENT EVALUATION
0.3
i
0.2
\
0.
0
0 1 2 3 4 5 6 7 8 9
t (min)
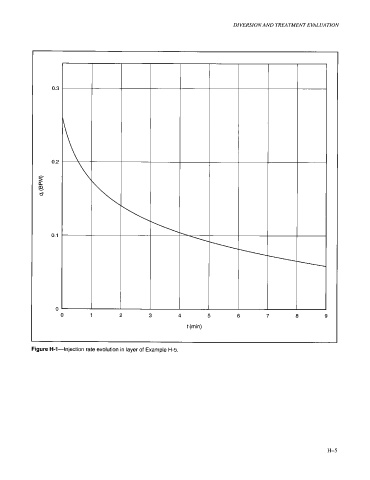
Figure H-1-Injection rate evolution in layer of Example H-5.
H-5