
Page 129 - A Practical Companion to Reservoir Stimulation
P. 129
PRACTICAL COMPANION TO RESERVOIR STIMULATION
EXAMPLE H-8
into a roughly constant departure from the one calculated from
Prediction of Pressure Response at Zero Skin Effect
the steady-state relationship.
After the change of the injection rate to 0.333 BPM, the
Both the Paccaloni technique and the Prouvost and Economides steady-state pressure response will experience the step drop
technique use a comparison between the measured bottomhole shown in Fig. H-2 after 20 min. The transient response,
injection pressure and the simulated injection pressure to though, would obey a superposition relationship (where At is
calculate the evolving skin effect. With the data appearing in from the time of the change in the injection rate).
Table H-4, develop and plot the pressure response vs. time.
What would happen if, after 20 min of injection, the injection Ap = Ap (t + At) + Ap (At), (H-34)
rate dropped from 1 BPM to 0.333 BPM?
wherelhe first pressure drop is at a rate of 1 BPM and the
Solution (Ref. Sections 1-2.2,16-3 and 16-4) second pressure drop at a rate equal to 0.333 - t = -0.667
The equation to calculate the pressure response (assuming that BPM (see Eq. 1-21). Thus, the injection pressure would be:
wellbore storage effects are eliminated quickly, wbich would 2.34 x 10⁵q, Bp
be the case in a high-permeability reservoir) is a modification Pn, = P, +
of Eq. 1-13: kh
162.6qBp
Pni = Pi +
kh
k
(H-31)
where q is in STB/d and t is in hours. Equation H-3 1 can be
modified to account for q, in BPM and t in minutes. log At + log ~ (H-35)
2.34 x 10⁵q, Bp
P,, = P, +
kh I
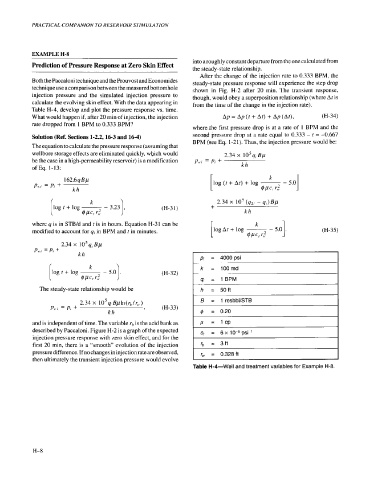
I pi = 4000psi
r k = 100md I
(H-32)
I 4, = 1 BPM I
The steady-state relationship would be I h = 50ft I
~
2.34 x 1 0 ~ph(~,/<, €3 = 1 resbbl/STB
~
P,!, = P, + (H-33)
kh 4 = 0.20
and is independent of time. The variable Q, is the acid bank as p = 1cp
described by Paccaloni. Figure H-2 is a graph of the expected - 0si-l
c+ = 6 x .-
injection pressure response with zero skin effect, and for the -, r -.
first 20 min, there is a “smooth” evolution of the injection rb = 3ft
pressure difference. If no changes in injection rate are observed, r, = 0.328ft
H-8