
Page 64 - A Practical Companion to Reservoir Stimulation
P. 64
PRACTICAL COMPANION TO RESERVOIR STIMULATION
EXAMPLE E-3
vertical lift performance (VLP) curve. Finally, Fig. E-4 is a
Combination of IPR and Vertical Lift Performance plot of the results. Similar plots can be constructed for the
cumula-tive production. As can be seen, increasing fracture
Suppose that the in E-l and E-2 is 'Oo0 ft length will result in increasing rates (increasing revenue).
with 27/8-in. tubing. The is 300 SCF/STB, and the However, the benefits flatten out while Costs increase rapidly.
wellhead pressure is 0 psi. What would be the producing rates This be demonstrated in later examples.
after I yr for xf= 500, 1000 and 1500 ft?
et al. (1980) I
Solution (Ref. Section 8-2.2 and I Page in Brown
Brown et al.: The Technology of Artificial Lijl,
PennWell Books, 1980) I I I I
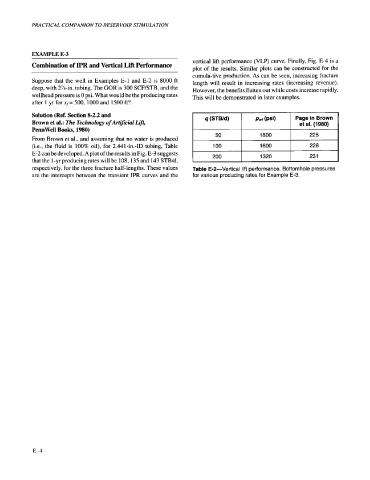
From Brown et al., and assuming that no water is produced . 50 1800 225
(i.e., the fluid is 100% oil), for 2.441-in.-ID tubing, Table 100 1600 228
E-2 can be developed. A plot of the results in Fig. E-3 suggests I 200 I 1320 I 231 I
that the 1 -yr producing rates will be 108, 135 and 143 STB/d,
respectively, for the three fracture half-lengths. These values Table E-2-Vertical lift performance. Bottomhole pressures
are the intercepts between the transient IPR curves and the for various producing rates for Example E-3.
E-4