
Page 222 - A Practical Introduction to Optical Mineralogy
P. 222
REFLECTED-LIGHT THEORY COLOUR OF MINERALS IN PPL
qualitatively. Quantitative colour values of ore minerals are readily
available in the IMNCOM DATA FILE (1977). They are presented as
three numbers: visual brightness (Y% ), corresponding approximately to
reflectance in white light; dominant wavelength (Act), which indicates the
hue of the colour; and saturation (P.% ), which indicates the strength of
the colour. Thus bright white with a slight greenish tint would corres-
pond to Y % = 50, Act = 585, P •% = 1 and bright green to Y % = 45,
Act = 585, P.% = 30. Colour values vary for the type of source; only the
A source (tungsten light) or C source (daylight) need be considered.
Cubic minerals have one reflectance curve and therefore one colour.
A non-cubic mineral has a colour for each of its reflectance curves, and
random sections are pleochroic but the pleochroism is usually very y
weak. Bireflection and pleochroism are closely related properties; the
former is used when the only change seen is in brightness, whereas the
latter is used if a change in colour, implying a change in dominant
wavelength or saturation, is seen. Simple colour terminology, e.g. bluish
white (not pale lavender blue!), should be used in mineral description.
It is important to emphasise that quantitative colour values can be
used as an aid to mineral identification without the need for the observer
to undertake spectral reflectance measurements. The use of quantitative
colour values will soon be appreciated if the exercise in Section 5.2.2 is
studied. An ore mineral identification scheme (NISOM1-81), based on
quantitative colour measurements using a microcomputer interfaced to
a reflected light microscope, has been developed and described by Atkin
and Harvey (1982).
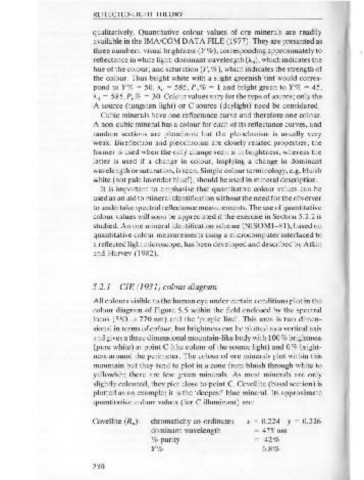
5.2.1 C1E (1931) colour diagram
Figure 5.5 The CIE (1931) colour diagram, colour areas (Judd 1952).
All colours visible to the human eye under certain conditions plot in the
colour diagram of Figure 5.5 within the field enclosed by the spectral
locus (380 ~ 770 nm) and the ' purple line' . This area is two dimen-
sional in terms of colour, but brightness can be plotted as a vertical axis
Note that the dominant wavelength is given by a projection of a line
and gives a three dimensional mountain-like body with 100% brightness
from C through Cov to the spectral locus, and the % purity is given by
(pure white) at point C (the colour of the source light) and 0% bright-
the closeness of Cov to the spectral locus, i.e. a!(a + b) x 100.
ness around the perimeter. The colour of ore minerals plot within this
mountain but they tend to plot in a zone from bluish through white to
yellowish; there are few green minerals. As most minerals are only
slightly coloured, they plot close to point C. Covellite (basal section) is 5.2.2 Exercise on quantitative colour values
plotted as an example; it is the 'deepest' blue mineral. Its approximate
quantitative colour values (for C illuminant) are: Chromaticity co-ordinates and the visual brightness (Y%) of an
unknown mineral (B), sphalerite and the basal section of covellite are
given on the CIE colour diagram Figure 5.6.
Covellite (R 0 ): chromaticity co-ordinates X = 0.224 y = 0.226
dominant wavelength = 475 nm Plot mineral B on the diagram and explain, using quantitative colour
values, how this mineral would appear in polished section. (Answer
% purity = 42 %
given at end of chapter.)
Y % = 6.8 %
210 211