
Page 153 - [B._MURPHY,_C._MURPHY,_B._HATHAWAY]_A_working_meth
P. 153
Chemical Kinetics 11 137
Maximum value ofy = 0.92; minimum value of y = -0.151.
+ A suitable y-axis scale is - 0.6 to 1 .O.
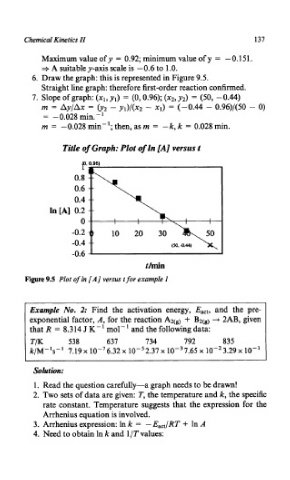
6. Draw the graph: this is represented in Figure 9.5.
Straight line graph: therefore first-order reaction confirmed.
7. Slope of graph: (xl, yl) = (0,0.96); (xz, y2) = (50, -0.44)
m = Ay/Ax = (y2 - y1)/(x2 - xl) = (-0.44 - 0.96)/(50 - 0)
= - 0.028 min. - '
m = -0.028 min-'; then, as m = -k, k = 0.028 min.
Title of Graph: Plot of In [A] versus t
In [A] 0.2 --
-0.2 1) 10 20 30
-0.4 --
-0.6
thin
Figure 9.5 Plot of In [A] versus t for example 1
Example No. 2: Find the activation energy, EaCt, and the pre-
exponential factor, A, for the reaction A2(g) + B2(g) -+ 2AB, given
that R = 8.314 J K-' mol-' and the following data:
T/K 538 637 734 792 835
k/M-'s-' 7.19 x 10-'6.32 x 2.37 x lov3 7.65 x 3.29 x lo-'
Solution:
1. Read the question carefully-a graph needs to be drawn!
2. Two sets of data are given: T, the temperature and k, the specific
rate constant. Temperature suggests that the expression for the
Arrhenius equation is involved.
3. Arrhenius expression: In k = -Eact/RT + In A
4. Need to obtain In k and l/Tvalues: