
Page 154 - [B._MURPHY,_C._MURPHY,_B._HATHAWAY]_A_working_meth
P. 154
138 Chapter 9
y-axis x-axis
k In k T 1/T
M-ls-l K K-’ x
7.19 x 10-~ - 14.15 538 1.86
6.32 x lo-’ - 9.67 637 1.57
2.37 x 10-~ - 6.04 734 1.36
7.65 x -2.57 792 1.26
3.29 x lo-’ -1.11 83 5 1.20
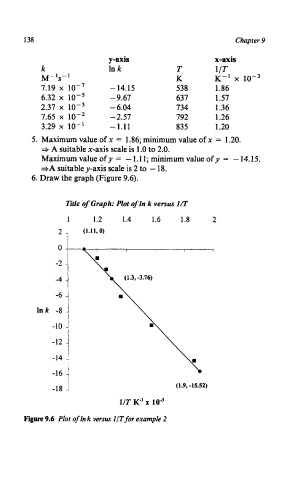
5. Maximum value of x = 1.86; minimum value of x = 1.20.
+ A suitable x-axis scale is 1 .O to 2.0.
Maximum value of y = - 1.1 1; minimum value of y = - 14.15.
+A suitable y-axis scale is 2 to - 18.
6. Draw the graph (Figure 9.6).
Title of Graph: Plot of In k versus I/T
1 1.2 1.4 1.6 1.8 2
(1.11,O)
0 1-
Ink -8
I
i
-10 2
I
-12 j
i
-14 I
-16
-18 1 (1.9, -15.52)
!
1/T K” x 10”
Figure 9.6 Plot of Ink versus ZIT for example 2