
Page 151 - [B._MURPHY,_C._MURPHY,_B._HATHAWAY]_A_working_meth
P. 151
Chemical Kinetics II 135
6. Examine the table in step 5. From this, write down the
maximum and minimum values of x and y respectively:
Maximum value of x = ; Minimum value of x = ;
Maximum value ofy = ; Minimum value of y = ,
This now determines an appropriate scale for the graph. At this
point, you might want to return to step 5, and ‘round off’ any
numbers for plotting purposes, but be careful with the number
of significantfigures for accuracy. Add an additional column in
the table if necessary.
7. Draw the graph on graph paper, and remember the following
points.
(a) Every graph must have a title.
(b) Label the two axes.
(c) Include the units on the axes, but remember, there are no
units for logarithmic values.
(d) Maximise the scale of the graph for accuracy.
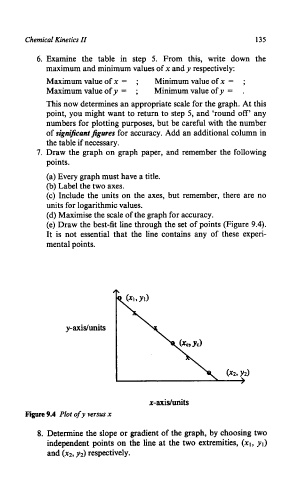
(e) Draw the best-fit line through the set of points (Figure 9.4).
It is not essential that the line contains any of these experi-
mental points.
y-axidunits
x-axidunits
Figure 9.4 Plot of y versus x
8. Determine the slope or gradient of the graph, by choosing two
independent points on the line at the two extremities, (XI, yl)
and (xz, y2) respectively.