
Page 112 - Acquisition and Processing of Marine Seismic Data
P. 112
2.4 SPECIFIC ACQUISITION TECHNIQUES 103
lithology variations and prediction of rock type the amplitude, phase and frequency characteris-
(Allouche et al., 2011). tics of P waves, which may result in distinctive
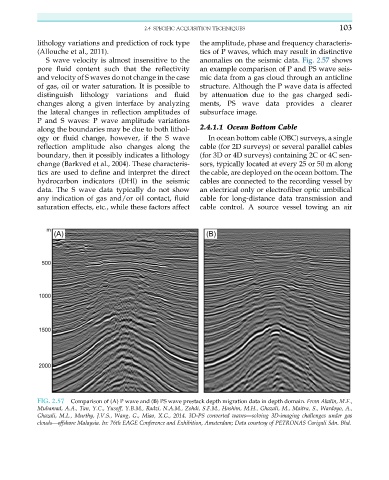
S wave velocity is almost insensitive to the anomalies on the seismic data. Fig. 2.57 shows
pore fluid content such that the reflectivity an example comparison of P and PS wave seis-
and velocity of S waves do not change in the case mic data from a gas cloud through an anticline
of gas, oil or water saturation. It is possible to structure. Although the P wave data is affected
distinguish lithology variations and fluid by attenuation due to the gas charged sedi-
changes along a given interface by analyzing ments, PS wave data provides a clearer
the lateral changes in reflection amplitudes of subsurface image.
P and S waves: P wave amplitude variations
along the boundaries may be due to both lithol- 2.4.1.1 Ocean Bottom Cable
ogy or fluid change, however, if the S wave In ocean bottom cable (OBC) surveys, a single
reflection amplitude also changes along the cable (for 2D surveys) or several parallel cables
boundary, then it possibly indicates a lithology (for 3D or 4D surveys) containing 2C or 4C sen-
change (Barkved et al., 2004). These characteris- sors, typically located at every 25 or 50 m along
tics are used to define and interpret the direct the cable, are deployed on the ocean bottom. The
hydrocarbon indicators (DHI) in the seismic cables are connected to the recording vessel by
data. The S wave data typically do not show an electrical only or electrofiber optic umbilical
any indication of gas and/or oil contact, fluid cable for long-distance data transmission and
saturation effects, etc., while these factors affect cable control. A source vessel towing an air
FIG. 2.57 Comparison of (A) P wave and (B) PS wave prestack depth migration data in depth domain. From Akalin, M.F.,
Muhamad, A.A., Tan, Y.C., Yusoff, Y.B.M., Radzi, N.A.M., Zohdi, S.F.M., Hashim, M.H., Ghazali, M., Maitra, S., Wardoyo, A.,
Ghazali, M.L., Murthy, J.V.S., Wang, G., Miao, X.G., 2014. 3D-PS converted waves—solving 3D-imaging challenges under gas
clouds—offshore Malaysia. In: 76th EAGE Conference and Exhibition, Amsterdam; Data courtesy of PETRONAS Carigali Sdn. Bhd.