
Page 281 - Acquisition and Processing of Marine Seismic Data
P. 281
272 5. PREPROCESSING
in the time domain. Processors must take extra 5.6 GAIN RECOVERY
care with band-pass filters to filter out a narrow
frequency band, and several tests on the selected Amplitude distribution along the time axis of
shots may be required to determine the opti- raw seismic data is not uniform, since the late
mum operator length. arrivals have much lower amplitudes while
Normally the filter operators are designed as the amplitudes of early arrivals from shallow
zero phase wavelets, which have amplitudes reflectors are relatively higher. Gain recovery
before zero time since they are not causal basically causes the data to have much more
(Yılmaz, 1987). After the convolution of this uniform amplitude distribution in both the shal-
operator with a minimum phase input signal low and deep portions by increasing the lower
during filtering, this noncausality results in side amplitude values of the late arrivals while
oscillations in the filtered output before the decreasing the higher amplitudes of the shallow
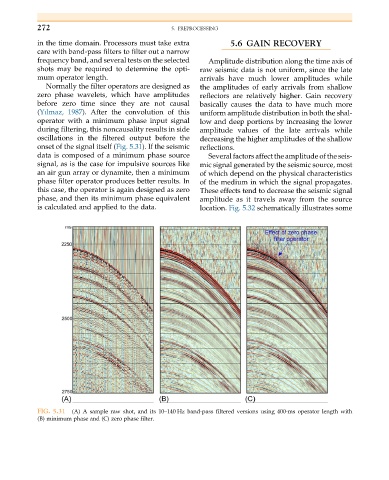
onset of the signal itself (Fig. 5.31). If the seismic reflections.
data is composed of a minimum phase source Several factors affect the amplitude of the seis-
signal, as is the case for impulsive sources like mic signal generated by the seismic source, most
an air gun array or dynamite, then a minimum of which depend on the physical characteristics
phase filter operator produces better results. In of the medium in which the signal propagates.
this case, the operator is again designed as zero These effects tend to decrease the seismic signal
phase, and then its minimum phase equivalent amplitude as it travels away from the source
is calculated and applied to the data. location. Fig. 5.32 schematically illustrates some
FIG. 5.31 (A) A sample raw shot, and its 10–140 Hz band-pass filtered versions using 400-ms operator length with
(B) minimum phase and (C) zero phase filter.