
Page 278 - Acquisition and Processing of Marine Seismic Data
P. 278
5.5 BAND-PASS FILTER 269
spectrum of a raw shot gather along with noise becomes more visible, especially at deeper
two close-ups for low (0–70 Hz) and high parts, if unnecessarily higher frequencies are
(70–220 Hz) frequency ends of the available incorporated in the pass-band (Fig. 5.27F and
frequency band, illustrating the areas where G). According to the filter panels in Fig. 5.27,
low-cut and high-cut frequencies can be deter- the suitable high-frequency cut-off can be
mined. Based on an amplitude spectrum as in selected as 100 Hz.
Fig. 5.26, a possible cut-off frequency pair for Fig. 5.28 shows similar test panels obtained
low and high frequencies is 10 and 120 Hz, by applying the same portion of the same brute
respectively. Below 10 Hz, swell noise dominates, stack section in Fig. 5.27, this time, however,
while predominantly random noise amplitudes with a varying low-frequency cut-off value for
exist above 120 Hz. a constant 250-Hz high-frequency cut-off. An
Before the application of a band-pass filter excessive removal of low-frequency compo-
with determined parameters, different filter nents from the seismic data causes much more
panels can be prepared to specify the most suit- dramatic results: details in the filtered output
able parameters for the filtering on a brute stack section are immediately lost (compare
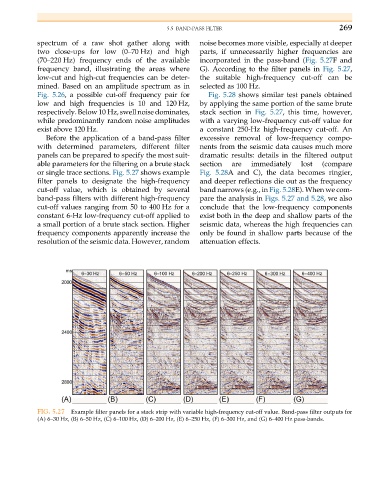
or single trace sections. Fig. 5.27 shows example Fig. 5.28A and C), the data becomes ringier,
filter panels to designate the high-frequency and deeper reflections die out as the frequency
cut-off value, which is obtained by several band narrows (e.g., in Fig. 5.28E). When we com-
band-pass filters with different high-frequency pare the analysis in Figs. 5.27 and 5.28, we also
cut-off values ranging from 50 to 400 Hz for a conclude that the low-frequency components
constant 6-Hz low-frequency cut-off applied to exist both in the deep and shallow parts of the
a small portion of a brute stack section. Higher seismic data, whereas the high frequencies can
frequency components apparently increase the only be found in shallow parts because of the
resolution of the seismic data. However, random attenuation effects.
FIG. 5.27 Example filter panels for a stack strip with variable high-frequency cut-off value. Band-pass filter outputs for
(A) 6–30 Hz, (B) 6–50 Hz, (C) 6–100 Hz, (D) 6–200 Hz, (E) 6–250 Hz, (F) 6–300 Hz, and (G) 6–400 Hz pass-bands.