
Page 275 - Acquisition and Processing of Marine Seismic Data
P. 275
266 5. PREPROCESSING
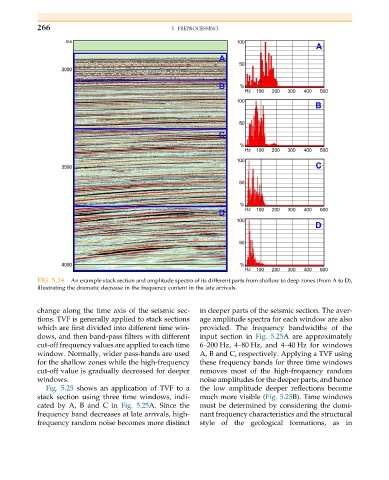
FIG. 5.24 An example stack section and amplitude spectra of its different parts from shallow to deep zones (from A to D),
illustrating the dramatic decrease in the frequency content in the late arrivals.
change along the time axis of the seismic sec- in deeper parts of the seismic section. The aver-
tions. TVF is generally applied to stack sections age amplitude spectra for each window are also
which are first divided into different time win- provided. The frequency bandwidths of the
dows, and then band-pass filters with different input section in Fig. 5.25A are approximately
cut-off frequency values are applied to each time 6–200 Hz, 4–80 Hz, and 4–40 Hz for windows
window. Normally, wider pass-bands are used A, B and C, respectively. Applying a TVF using
for the shallow zones while the high-frequency these frequency bands for three time windows
cut-off value is gradually decreased for deeper removes most of the high-frequency random
windows. noise amplitudes for the deeper parts, and hence
Fig. 5.25 shows an application of TVF to a the low amplitude deeper reflections become
stack section using three time windows, indi- much more visible (Fig. 5.25B). Time windows
cated by A, B and C in Fig. 5.25A. Since the must be determined by considering the domi-
frequency band decreases at late arrivals, high- nant frequency characteristics and the structural
frequency random noise becomes more distinct style of the geological formations, as in