
Page 273 - Acquisition and Processing of Marine Seismic Data
P. 273
264 5. PREPROCESSING
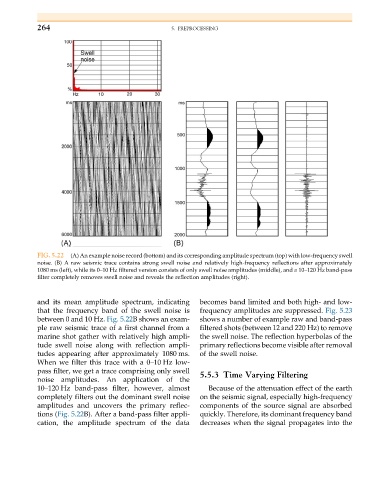
FIG. 5.22 (A) An example noise record (bottom) and its corresponding amplitude spectrum (top) with low-frequency swell
noise. (B) A raw seismic trace contains strong swell noise and relatively high-frequency reflections after approximately
1080 ms (left), while its 0–10 Hz filtered version consists of only swell noise amplitudes (middle), and a 10–120 Hz band-pass
filter completely removes swell noise and reveals the reflection amplitudes (right).
and its mean amplitude spectrum, indicating becomes band limited and both high- and low-
that the frequency band of the swell noise is frequency amplitudes are suppressed. Fig. 5.23
between 0 and 10 Hz. Fig. 5.22B shows an exam- shows a number of example raw and band-pass
ple raw seismic trace of a first channel from a filtered shots (between 12 and 220 Hz) to remove
marine shot gather with relatively high ampli- the swell noise. The reflection hyperbolas of the
tude swell noise along with reflection ampli- primary reflections become visible after removal
tudes appearing after approximately 1080 ms. of the swell noise.
When we filter this trace with a 0–10 Hz low-
pass filter, we get a trace comprising only swell 5.5.3 Time Varying Filtering
noise amplitudes. An application of the
10–120 Hz band-pass filter, however, almost Because of the attenuation effect of the earth
completely filters out the dominant swell noise on the seismic signal, especially high-frequency
amplitudes and uncovers the primary reflec- components of the source signal are absorbed
tions (Fig. 5.22B). After a band-pass filter appli- quickly. Therefore, its dominant frequency band
cation, the amplitude spectrum of the data decreases when the signal propagates into the