
Page 272 - Acquisition and Processing of Marine Seismic Data
P. 272
5.5 BAND-PASS FILTER 263
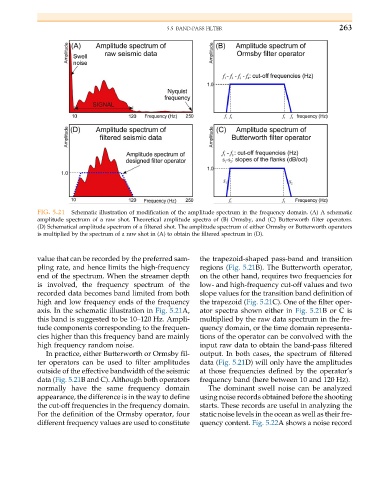
FIG. 5.21 Schematic illustration of modification of the amplitude spectrum in the frequency domain. (A) A schematic
amplitude spectrum of a raw shot. Theoretical amplitude spectra of (B) Ormsby, and (C) Butterworth filter operators.
(D) Schematical amplitude spectrum of a filtered shot. The amplitude spectrum of either Ormsby or Butterworth operators
is multiplied by the spectrum of a raw shot in (A) to obtain the filtered spectrum in (D).
value that can be recorded by the preferred sam- the trapezoid-shaped pass-band and transition
pling rate, and hence limits the high-frequency regions (Fig. 5.21B). The Butterworth operator,
end of the spectrum. When the streamer depth on the other hand, requires two frequencies for
is involved, the frequency spectrum of the low- and high-frequency cut-off values and two
recorded data becomes band limited from both slope values for the transition band definition of
high and low frequency ends of the frequency the trapezoid (Fig. 5.21C). One of the filter oper-
axis. In the schematic illustration in Fig. 5.21A, ator spectra shown either in Fig. 5.21Bor C is
this band is suggested to be 10–120 Hz. Ampli- multiplied by the raw data spectrum in the fre-
tude components corresponding to the frequen- quency domain, or the time domain representa-
cies higher than this frequency band are mainly tions of the operator can be convolved with the
high frequency random noise. input raw data to obtain the band-pass filtered
In practice, either Butterworth or Ormsby fil- output. In both cases, the spectrum of filtered
ter operators can be used to filter amplitudes data (Fig. 5.21D) will only have the amplitudes
outside of the effective bandwidth of the seismic at those frequencies defined by the operator’s
data (Fig. 5.21B and C). Although both operators frequency band (here between 10 and 120 Hz).
normally have the same frequency domain The dominant swell noise can be analyzed
appearance, the difference is in the way to define using noise records obtained before the shooting
the cut-off frequencies in the frequency domain. starts. These records are useful in analyzing the
For the definition of the Ormsby operator, four static noise levels in the ocean as well as their fre-
different frequency values are used to constitute quency content. Fig. 5.22A shows a noise record