
Page 277 - Acquisition and Processing of Marine Seismic Data
P. 277
268 5. PREPROCESSING
Fig. 5.25A. In addition, windows may overlap if The following parameters are predetermined
required. However, if the high-frequency cut-off before frequency filtering:
values for each window are not close to each i. Cut-off frequency values
other, amplitude artifacts with abnormally low ii. Time domain operator length
amplitudes may arise along the overlap zones iii. Domain of application (time or frequency)
after gain application.
iv. Type of filter (Ormsby or Butterworth)
v. Phase of the filter (minimum or zero)
5.5.4 QC in Band-Pass Filtering
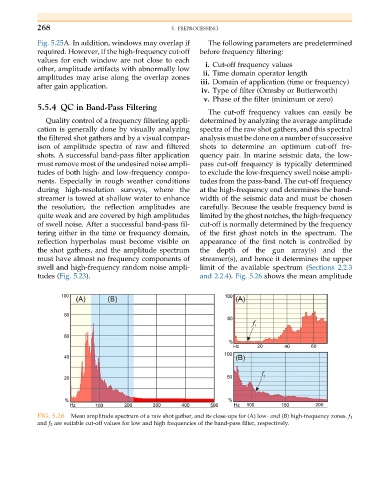
The cut-off frequency values can easily be
Quality control of a frequency filtering appli- determined by analyzing the average amplitude
cation is generally done by visually analyzing spectra of the raw shot gathers, and this spectral
the filtered shot gathers and by a visual compar- analysis must be done on a number of successive
ison of amplitude spectra of raw and filtered shots to determine an optimum cut-off fre-
shots. A successful band-pass filter application quency pair. In marine seismic data, the low-
must remove most of the undesired noise ampli- pass cut-off frequency is typically determined
tudes of both high- and low-frequency compo- to exclude the low-frequency swell noise ampli-
nents. Especially in rough weather conditions tudes from the pass-band. The cut-off frequency
during high-resolution surveys, where the at the high-frequency end determines the band-
streamer is towed at shallow water to enhance width of the seismic data and must be chosen
the resolution, the reflection amplitudes are carefully. Because the usable frequency band is
quite weak and are covered by high amplitudes limited by the ghost notches, the high-frequency
of swell noise. After a successful band-pass fil- cut-off is normally determined by the frequency
tering either in the time or frequency domain, of the first ghost notch in the spectrum. The
reflection hyperbolas must become visible on appearance of the first notch is controlled by
the shot gathers, and the amplitude spectrum the depth of the gun array(s) and the
must have almost no frequency components of streamer(s), and hence it determines the upper
swell and high-frequency random noise ampli- limit of the available spectrum (Sections 2.2.3
tudes (Fig. 5.23). and 2.2.4). Fig. 5.26 shows the mean amplitude
FIG. 5.26 Mean amplitude spectrum of a raw shot gather, and its close-ups for (A) low- and (B) high-frequency zones. f 1
and f 2 are suitable cut-off values for low and high frequencies of the band-pass filter, respectively.