
Page 274 - Acquisition and Processing of Marine Seismic Data
P. 274
5.5 BAND-PASS FILTER 265
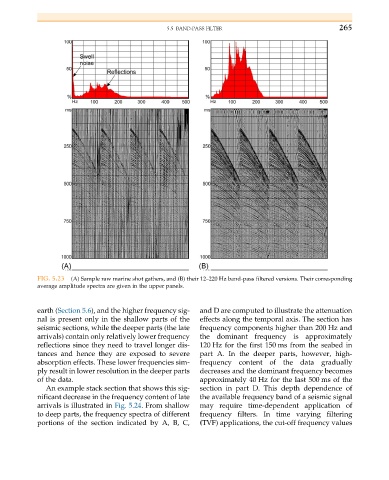
FIG. 5.23 (A) Sample raw marine shot gathers, and (B) their 12–220 Hz band-pass filtered versions. Their corresponding
average amplitude spectra are given in the upper panels.
earth (Section 5.6), and the higher frequency sig- and D are computed to illustrate the attenuation
nal is present only in the shallow parts of the effects along the temporal axis. The section has
seismic sections, while the deeper parts (the late frequency components higher than 200 Hz and
arrivals) contain only relatively lower frequency the dominant frequency is approximately
reflections since they need to travel longer dis- 120 Hz for the first 150 ms from the seabed in
tances and hence they are exposed to severe part A. In the deeper parts, however, high-
absorption effects. These lower frequencies sim- frequency content of the data gradually
ply result in lower resolution in the deeper parts decreases and the dominant frequency becomes
of the data. approximately 40 Hz for the last 500 ms of the
An example stack section that shows this sig- section in part D. This depth dependence of
nificant decrease in the frequency content of late the available frequency band of a seismic signal
arrivals is illustrated in Fig. 5.24. From shallow may require time-dependent application of
to deep parts, the frequency spectra of different frequency filters. In time varying filtering
portions of the section indicated by A, B, C, (TVF) applications, the cut-off frequency values