
Page 367 - Acquisition and Processing of Marine Seismic Data
P. 367
358 6. DECONVOLUTION
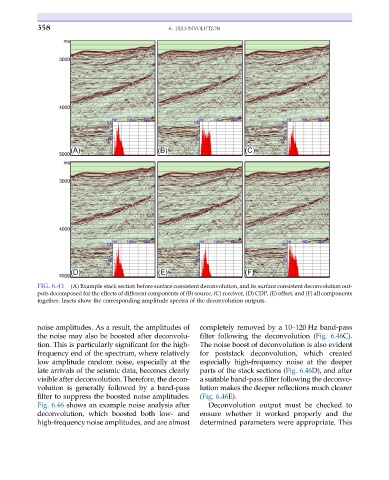
FIG. 6.43 (A) Example stack section before surface consistent deconvolution, and its surface consistent deconvolution out-
puts decomposed for the effects of different components of (B) source, (C) receiver, (D) CDP, (E) offset, and (F) all components
together. Insets show the corresponding amplitude spectra of the deconvolution outputs.
noise amplitudes. As a result, the amplitudes of completely removed by a 10–120 Hz band-pass
the noise may also be boosted after deconvolu- filter following the deconvolution (Fig. 6.46C).
tion. This is particularly significant for the high- The noise boost of deconvolution is also evident
frequency end of the spectrum, where relatively for poststack deconvolution, which created
low amplitude random noise, especially at the especially high-frequency noise at the deeper
late arrivals of the seismic data, becomes clearly parts of the stack sections (Fig. 6.46D), and after
visible after deconvolution. Therefore, the decon- a suitable band-pass filter following the deconvo-
volution is generally followed by a band-pass lution makes the deeper reflections much clearer
filter to suppress the boosted noise amplitudes. (Fig. 6.46E).
Fig. 6.46 shows an example noise analysis after Deconvolution output must be checked to
deconvolution, which boosted both low- and ensure whether it worked properly and the
high-frequency noise amplitudes, and are almost determined parameters were appropriate. This