
Page 370 - Acquisition and Processing of Marine Seismic Data
P. 370
6.10 QC IN DECONVOLUTION 361
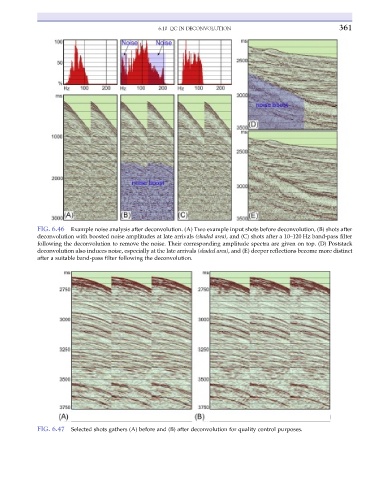
FIG. 6.46 Example noise analysis after deconvolution. (A) Two example input shots before deconvolution, (B) shots after
deconvolution with boosted noise amplitudes at late arrivals (shaded area), and (C) shots after a 10–120 Hz band-pass filter
following the deconvolution to remove the noise. Their corresponding amplitude spectra are given on top. (D) Poststack
deconvolution also induces noise, especially at the late arrivals (shaded area), and (E) deeper reflections become more distinct
after a suitable band-pass filter following the deconvolution.
FIG. 6.47 Selected shots gathers (A) before and (B) after deconvolution for quality control purposes.