
Page 383 - Acquisition and Processing of Marine Seismic Data
P. 383
374 7. SUPPRESSION OF MULTIPLE REFLECTIONS
amplitude spectrum of the seismogram successive multiples is almost constant in near
(Fig. 6.12). As the time span between the multi- offset traces, it progressively increases for far
ple reflections in the time series increases, the offsets. This is also evident on the autocorrelo-
notches in the spectrum get closer to each other. grams of the shot gather in Fig. 7.9C, in which
Predictive deconvolution can be used to the multiple energy is not horizontal but curved
remove the multiple energy from the seismic towards the far offsets, indicating that the
data by predicting and suppressing the multiple periods of the multiples decrease at far offsets.
reflection series. A successful predictive decon- In deconvolution application, an optimal
volution can remove the complete multiple selection of prediction lag and operator length
energy from the seismic data, provided that all parameters is crucial. Fig. 7.10A shows the atten-
of the assumptions listed in Section 6.2 are satis- uation rates of the multiple amplitudes by pre-
fied. Deconvolution is particularly efficient on dictive deconvolution for a range of prediction
short period multiples, and almost ineffective lag and operator length values. In this example,
on the multiples with a period larger than a synthetic seismic trace with one primary reflec-
approximately 200 ms. This is because the peri- tion and its multiple is used (Fig. 7.10B), and the
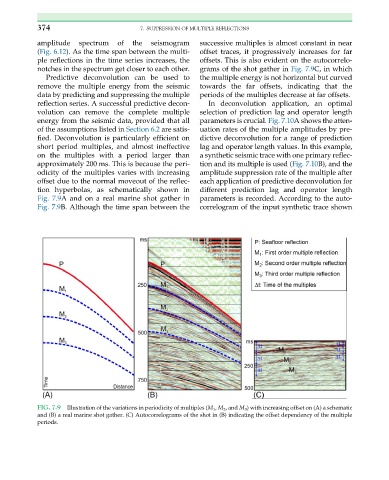
odicity of the multiples varies with increasing amplitude suppression rate of the multiple after
offset due to the normal moveout of the reflec- each application of predictive deconvolution for
tion hyperbolas, as schematically shown in different prediction lag and operator length
Fig. 7.9A and on a real marine shot gather in parameters is recorded. According to the auto-
Fig. 7.9B. Although the time span between the correlogram of the input synthetic trace shown
FIG. 7.9 Illustration of the variations in periodicity of multiples (M 1 , M 2 , and M 3 ) with increasing offset on (A) a schematic
and (B) a real marine shot gather. (C) Autocorrelograms of the shot in (B) indicating the offset dependency of the multiple
periods.