
Page 444 - Acquisition and Processing of Marine Seismic Data
P. 444
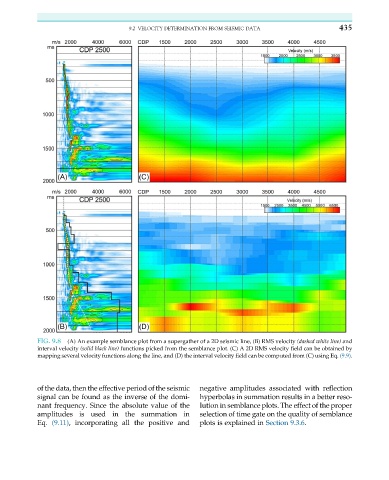
9.2 VELOCITY DETERMINATION FROM SEISMIC DATA              435


           FIG. 9.8  (A) An example semblance plot from a supergather of a 2D seismic line, (B) RMS velocity (dashed white line) and
           interval velocity (solid black line) functions picked from the semblance plot. (C) A 2D RMS velocity field can be obtained by
           mapping several velocity functions along the line, and (D) the interval velocity field can be computed from (C) using Eq. (9.9).


           of the data, then the effective period of the seismic  negative amplitudes associated with reflection
           signal can be found as the inverse of the domi-  hyperbolas in summation results in a better reso-
           nant frequency. Since the absolute value of the  lution in semblance plots. The effect of the proper
           amplitudes is used in the summation in       selection of time gate on the quality of semblance
           Eq. (9.11), incorporating all the positive and  plots is explained in Section 9.3.6.