
Page 445 - Acquisition and Processing of Marine Seismic Data
P. 445
436 9. VELOCITY ANALYSIS
Signal-to-noise ratio (S/N) of the marine seis-
mic data is generally much higher than that of
land data, and therefore velocity analysis of off-
shore seismic datasets is more straightforward
and velocity picking is more accurate. However,
there are important points to consider during
the velocity analysis, such as the noise content
of the data. Furthermore, the limitations arising
from the nature of data collection may decrease
the efficiency and accuracy of velocity analysis.
For instance, the accuracy is relatively poor for
late arrivals of the data collected with a short
streamer cable.
In this section, some of the factors listed are
evaluated on synthetic and real CDPs and their
effects on velocity analysis is discussed. The syn-
thetic data is calculated by a simple 1D convolu-
tional model approach to obtain the arrival
times of six individual reflections at 120 traces.
The parameters used in travel time computa-
tions are shown in Fig. 9.10A. A 120-fold syn-
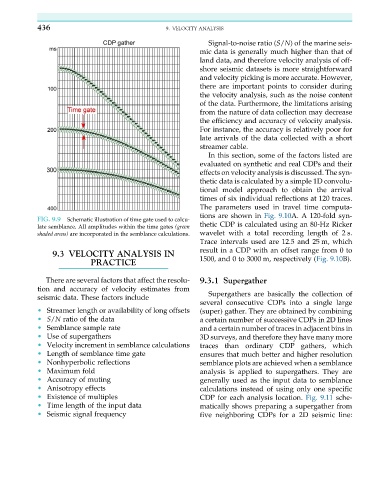
FIG. 9.9 Schematic illustration of time gate used to calcu-
late semblance. All amplitudes within the time gates (green thetic CDP is calculated using an 80-Hz Ricker
shaded areas) are incorporated in the semblance calculations. wavelet with a total recording length of 2 s.
Trace intervals used are 12.5 and 25 m, which
result in a CDP with an offset range from 0 to
9.3 VELOCITY ANALYSIS IN
PRACTICE 1500, and 0 to 3000 m, respectively (Fig. 9.10B).
There are several factors that affect the resolu- 9.3.1 Supergather
tion and accuracy of velocity estimates from
Supergathers are basically the collection of
seismic data. These factors include
several consecutive CDPs into a single large
• Streamer length or availability of long offsets (super) gather. They are obtained by combining
• S/N ratio of the data a certain number of successive CDPs in 2D lines
• Semblance sample rate and a certain number of traces in adjacent bins in
• Use of supergathers 3D surveys, and therefore they have many more
• Velocity increment in semblance calculations traces than ordinary CDP gathers, which
• Length of semblance time gate ensures that much better and higher resolution
• Nonhyperbolic reflections semblance plots are achieved when a semblance
• Maximum fold analysis is applied to supergathers. They are
• Accuracy of muting generally used as the input data to semblance
• Anisotropy effects calculations instead of using only one specific
• Existence of multiples CDP for each analysis location. Fig. 9.11 sche-
• Time length of the input data matically shows preparing a supergather from
• Seismic signal frequency five neighboring CDPs for a 2D seismic line: