
Page 450 - Acquisition and Processing of Marine Seismic Data
P. 450
9.3 VELOCITY ANALYSIS IN PRACTICE 441
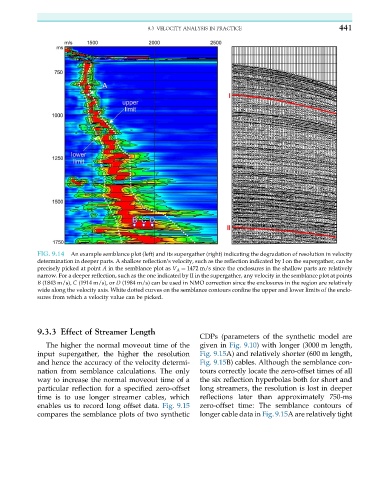
FIG. 9.14 An example semblance plot (left) and its supergather (right) indicating the degradation of resolution in velocity
determination in deeper parts. A shallow reflection’s velocity, such as the reflection indicated by I on the supergather, can be
precisely picked at point A in the semblance plot as V A ¼ 1472 m/s since the enclosures in the shallow parts are relatively
narrow. For a deeper reflection, such as the one indicated by II in the supergather, any velocity in the semblance plot at points
B (1843 m/s), C (1914 m/s), or D (1984 m/s) can be used in NMO correction since the enclosures in the region are relatively
wide along the velocity axis. White dotted curves on the semblance contours confine the upper and lower limits of the enclo-
sures from which a velocity value can be picked.
9.3.3 Effect of Streamer Length
CDPs (parameters of the synthetic model are
The higher the normal moveout time of the given in Fig. 9.10) with longer (3000 m length,
input supergather, the higher the resolution Fig. 9.15A) and relatively shorter (600 m length,
and hence the accuracy of the velocity determi- Fig. 9.15B) cables. Although the semblance con-
nation from semblance calculations. The only tours correctly locate the zero-offset times of all
way to increase the normal moveout time of a the six reflection hyperbolas both for short and
particular reflection for a specified zero-offset long streamers, the resolution is lost in deeper
time is to use longer streamer cables, which reflections later than approximately 750-ms
enables us to record long offset data. Fig. 9.15 zero-offset time: The semblance contours of
compares the semblance plots of two synthetic longer cable data in Fig. 9.15A are relatively tight