
Page 451 - Acquisition and Processing of Marine Seismic Data
P. 451
442 9. VELOCITY ANALYSIS
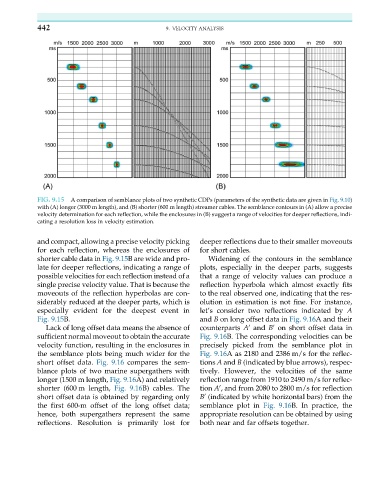
FIG. 9.15 A comparison of semblance plots of two synthetic CDPs (parameters of the synthetic data are given in Fig. 9.10)
with (A) longer (3000 m length), and (B) shorter (600 m length) streamer cables. The semblance contours in (A) allow a precise
velocity determination for each reflection, while the enclosures in (B) suggest a range of velocities for deeper reflections, indi-
cating a resolution loss in velocity estimation.
and compact, allowing a precise velocity picking deeper reflections due to their smaller moveouts
for each reflection, whereas the enclosures of for short cables.
shorter cable data in Fig. 9.15B are wide and pro- Widening of the contours in the semblance
late for deeper reflections, indicating a range of plots, especially in the deeper parts, suggests
possible velocities for each reflection instead of a that a range of velocity values can produce a
single precise velocity value. That is because the reflection hyperbola which almost exactly fits
moveouts of the reflection hyperbolas are con- to the real observed one, indicating that the res-
siderably reduced at the deeper parts, which is olution in estimation is not fine. For instance,
especially evident for the deepest event in let’s consider two reflections indicated by A
Fig. 9.15B. and B on long offset data in Fig. 9.16A and their
Lack of long offset data means the absence of counterparts A and B on short offset data in
0
0
sufficient normal moveout to obtain the accurate Fig. 9.16B. The corresponding velocities can be
velocity function, resulting in the enclosures in precisely picked from the semblance plot in
the semblance plots being much wider for the Fig. 9.16A as 2180 and 2386 m/s for the reflec-
short offset data. Fig. 9.16 compares the sem- tions A and B (indicated by blue arrows), respec-
blance plots of two marine supergathers with tively. However, the velocities of the same
longer (1500 m length, Fig. 9.16A) and relatively reflection range from 1910 to 2490 m/s for reflec-
shorter (600 m length, Fig. 9.16B) cables. The tion A , and from 2080 to 2800 m/s for reflection
0
0
short offset data is obtained by regarding only B (indicated by white horizontal bars) from the
the first 600-m offset of the long offset data; semblance plot in Fig. 9.16B. In practice, the
hence, both supergathers represent the same appropriate resolution can be obtained by using
reflections. Resolution is primarily lost for both near and far offsets together.