
Page 447 - Acquisition and Processing of Marine Seismic Data
P. 447
438 9. VELOCITY ANALYSIS
traces of five successive CDPs are combined, the velocity functions are obtained to form a
and the resultant supergather is assigned to 3D RMS velocity field. A finer grid with smaller
the location of the central CDP. crossline and inline increments ensures a more
In 3D surveys, the traces of adjacent bins accurate velocity field.
along inline and crossline directions are com- The offsets of traces within each CDP gather
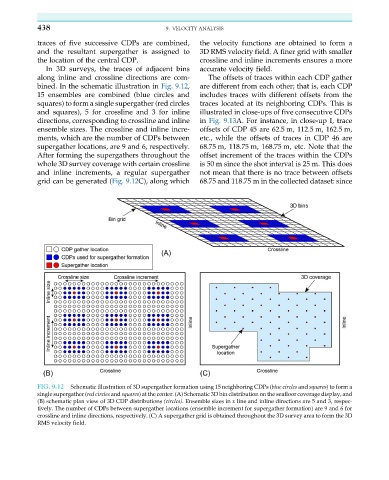
bined. In the schematic illustration in Fig. 9.12, are different from each other; that is, each CDP
15 ensembles are combined (blue circles and includes traces with different offsets from the
squares) to form a single supergather (red circles traces located at its neighboring CDPs. This is
and squares), 5 for crossline and 3 for inline illustrated in close-ups of five consecutive CDPs
directions, corresponding to crossline and inline in Fig. 9.13A. For instance, in close-up I, trace
ensemble sizes. The crossline and inline incre- offsets of CDP 45 are 62.5 m, 112.5 m, 162.5 m,
ments, which are the number of CDPs between etc., while the offsets of traces in CDP 46 are
supergather locations, are 9 and 6, respectively. 68.75 m, 118.75 m, 168.75 m, etc. Note that the
After forming the supergathers throughout the offset increment of the traces within the CDPs
whole 3D survey coverage with certain crossline is 50 m since the shot interval is 25 m. This does
and inline increments, a regular supergather not mean that there is no trace between offsets
grid can be generated (Fig. 9.12C), along which 68.75 and 118.75 m in the collected dataset: since
FIG. 9.12 Schematic illustration of 3D supergather formation using 15 neighboring CDPs (blue circles and squares) to form a
single supergather (red circles and squares) at the center. (A) Schematic 3D bin distribution on the seafloor coverage display, and
(B) schematic plan view of 3D CDP distributions (circles). Ensemble sizes in x line and inline directions are 5 and 3, respec-
tively. The number of CDPs between supergather locations (ensemble increment for supergather formation) are 9 and 6 for
crossline and inline directions, respectively. (C) A supergather grid is obtained throughout the 3D survey area to form the 3D
RMS velocity field.