
Page 498 - Acquisition and Processing of Marine Seismic Data
P. 498
10.5 QC IN NMO CORRECTION AND STACKING 489
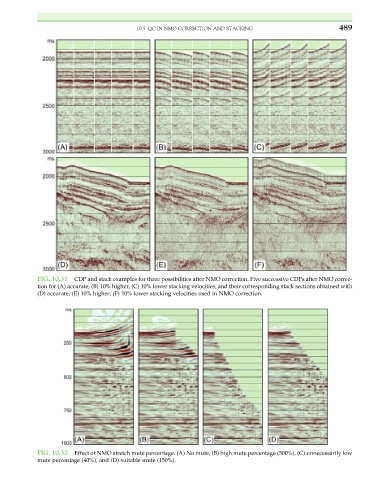
FIG. 10.31 CDP and stack examples for three possibilities after NMO correction. Five successive CDPs after NMO correc-
tion for (A) accurate, (B) 10% higher, (C) 10% lower stacking velocities, and their corresponding stack sections obtained with
(D) accurate, (E) 10% higher, (F) 10% lower stacking velocities used in NMO correction.
FIG. 10.32 Effect of NMO stretch mute percentage. (A) No mute, (B) high mute percentage (500%), (C) unnecessarily low
mute percentage (40%), and (D) suitable mute (150%).