
Page 493 - Acquisition and Processing of Marine Seismic Data
P. 493
484 10. NORMAL MOVEOUT CORRECTION AND STACKING
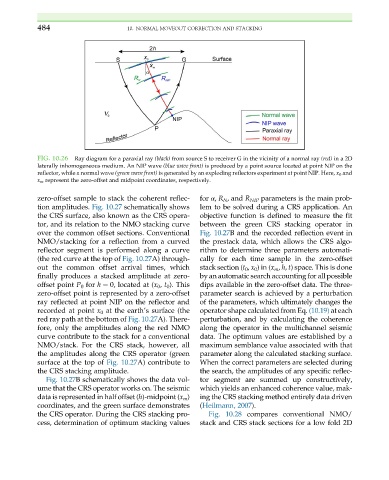
FIG. 10.26 Ray diagram for a paraxial ray (black) from source S to receiver G in the vicinity of a normal ray (red) in a 2D
laterally inhomogeneous medium. An NIP wave (blue wave front) is produced by a point source located at point NIP on the
reflector, while a normal wave (green wave front) is generated by an exploding reflectors experiment at point NIP. Here, x 0 and
x m represent the zero-offset and midpoint coordinates, respectively.
zero-offset sample to stack the coherent reflec- for α, R N ,and R NIP parameters is the main prob-
tion amplitudes. Fig. 10.27 schematically shows lem to be solved during a CRS application. An
the CRS surface, also known as the CRS opera- objective function is defined to measure the fit
tor, and its relation to the NMO stacking curve between the green CRS stacking operator in
over the common offset sections. Conventional Fig. 10.27B and the recorded reflection event in
NMO/stacking for a reflection from a curved the prestack data, which allows the CRS algo-
reflector segment is performed along a curve rithm to determine three parameters automati-
(the red curve at the top of Fig. 10.27A) through- cally for each time sample in the zero-offset
out the common offset arrival times, which stack section (t 0 , x 0 )in(x m , h, t)space.This isdone
finally produces a stacked amplitude at zero- by an automatic search accounting for all possible
offset point P 0 for h ¼ 0, located at (x 0 , t 0 ). This dips available in the zero-offset data. The three-
zero-offset point is represented by a zero-offset parameter search is achieved by a perturbation
ray reflected at point NIP on the reflector and of the parameters, which ultimately changes the
recorded at point x 0 at the earth’s surface (the operator shape calculated from Eq. (10.19) at each
red ray path at the bottom of Fig. 10.27A). There- perturbation, and by calculating the coherence
fore, only the amplitudes along the red NMO along the operator in the multichannel seismic
curve contribute to the stack for a conventional data. The optimum values are established by a
NMO/stack. For the CRS stack, however, all maximum semblance value associated with that
the amplitudes along the CRS operator (green parameter along the calculated stacking surface.
surface at the top of Fig. 10.27A) contribute to When the correct parameters are selected during
the CRS stacking amplitude. the search, the amplitudes of any specific reflec-
Fig. 10.27Bschematically shows the datavol- tor segment are summed up constructively,
ume that the CRS operator works on. The seismic which yields an enhanced coherence value, mak-
data is represented in half offset (h)-midpoint (x m ) ing the CRS stacking method entirely data driven
coordinates, and the green surface demonstrates (Heilmann, 2007).
the CRS operator. During the CRS stacking pro- Fig. 10.28 compares conventional NMO/
cess, determination of optimum stacking values stack and CRS stack sections for a low fold 2D