
Page 490 - Acquisition and Processing of Marine Seismic Data
P. 490
10.4 SPECIFIC STACKING METHODS 481
series of amplitude values sorted in ascending Fig. 10.25 shows an application of trimmed
order. In practice, a percentage value of stack on the same marine seismic data used in
p ¼ m/(n 1) is used instead of the number of Fig. 10.22A. A 10% trimmed stack leaves some
neglected amplitudes. In practice, as the p residual noise on the final stack; however, a
increases from 0% to 100%, trimmed stack 20% value seems to be appropriate for this data-
changes from mean stack to median stack. set. The trimmed stack excludes the extreme
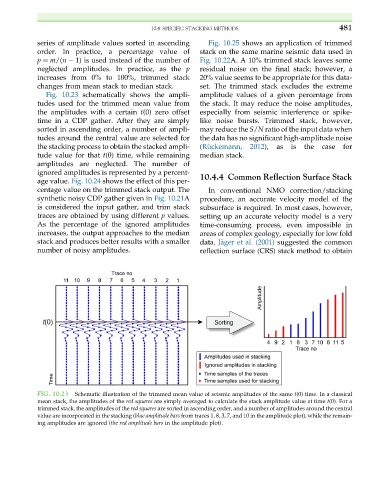
Fig. 10.23 schematically shows the ampli- amplitude values of a given percentage from
tudes used for the trimmed mean value from the stack. It may reduce the noise amplitudes,
the amplitudes with a certain t(0) zero offset especially from seismic interference or spike-
time in a CDP gather. After they are simply like noise bursts. Trimmed stack, however,
sorted in ascending order, a number of ampli- may reduce the S/N ratio of the input data when
tudes around the central value are selected for the data has no significant high-amplitude noise
the stacking process to obtain the stacked ampli- (R€ uckemann, 2012), as is the case for
tude value for that t(0) time, while remaining median stack.
amplitudes are neglected. The number of
ignored amplitudes is represented by a percent- 10.4.4 Common Reflection Surface Stack
age value. Fig. 10.24 shows the effect of this per-
centage value on the trimmed stack output. The In conventional NMO correction/stacking
synthetic noisy CDP gather given in Fig. 10.21A procedure, an accurate velocity model of the
is considered the input gather, and trim stack subsurface is required. In most cases, however,
traces are obtained by using different p values. setting up an accurate velocity model is a very
As the percentage of the ignored amplitudes time-consuming process, even impossible in
increases, the output approaches to the median areas of complex geology, especially for low fold
stack and produces better results with a smaller data. J€ ager et al. (2001) suggested the common
number of noisy amplitudes. reflection surface (CRS) stack method to obtain
FIG. 10.23 Schematic illustration of the trimmed mean value of seismic amplitudes of the same t(0) time. In a classical
mean stack, the amplitudes of the red squares are simply averaged to calculate the stack amplitude value at time t(0). For a
trimmed stack, the amplitudes of the red squares are sorted in ascending order, and a number of amplitudes around the central
value are incorporated in the stacking (blue amplitude bars from traces 1, 8, 3, 7, and 10 in the amplitude plot), while the remain-
ing amplitudes are ignored (the red amplitude bars in the amplitude plot).