
Page 488 - Acquisition and Processing of Marine Seismic Data
P. 488
10.4 SPECIFIC STACKING METHODS 479
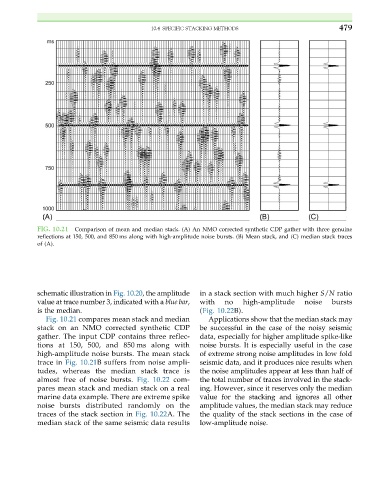
FIG. 10.21 Comparison of mean and median stack. (A) An NMO corrected synthetic CDP gather with three genuine
reflections at 150, 500, and 850 ms along with high-amplitude noise bursts. (B) Mean stack, and (C) median stack traces
of (A).
schematic illustration in Fig. 10.20, the amplitude in astack sectionwithmuchhigher S/N ratio
value at trace number 3, indicated with a blue bar, with no high-amplitude noise bursts
is the median. (Fig. 10.22B).
Fig. 10.21 compares mean stack and median Applications show that the median stack may
stack on an NMO corrected synthetic CDP be successful in the case of the noisy seismic
gather. The input CDP contains three reflec- data, especially for higher amplitude spike-like
tions at 150, 500, and 850 ms along with noise bursts. It is especially useful in the case
high-amplitude noise bursts. The mean stack of extreme strong noise amplitudes in low fold
trace in Fig. 10.21B suffers from noise ampli- seismic data, and it produces nice results when
tudes, whereas the median stack trace is the noise amplitudes appear at less than half of
almost free of noise bursts. Fig. 10.22 com- the total number of traces involved in the stack-
pares mean stack and median stack on a real ing. However, since it reserves only the median
marine data example. There are extreme spike value for the stacking and ignores all other
noise bursts distributed randomly on the amplitude values, the median stack may reduce
traces of the stack section in Fig. 10.22A. The the quality of the stack sections in the case of
median stack of the same seismic data results low-amplitude noise.