
Page 487 - Acquisition and Processing of Marine Seismic Data
P. 487
478 10. NORMAL MOVEOUT CORRECTION AND STACKING
FIG. 10.19 (A) Full stack section indicating an anticline structure, (B) near offset stack with an offset range from 0 to 300 m,
and (C) far offset stack with an offset range from 2000 to 2800 m. The far offset stack indicates several bright spots below the
anticline (area in the dashed rectangle). Only true amplitude recovery was applied as gain correction for all three sections.
CDP 6120 locates the CDP gather shown in Fig. 10.18A.
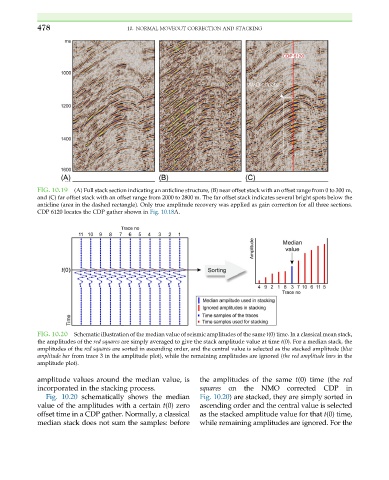
FIG. 10.20 Schematic illustration of the median value of seismic amplitudes of the same t(0) time. In a classical mean stack,
the amplitudes of the red squares are simply averaged to give the stack amplitude value at time t(0). For a median stack, the
amplitudes of the red squares are sorted in ascending order, and the central value is selected as the stacked amplitude (blue
amplitude bar from trace 3 in the amplitude plot), while the remaining amplitudes are ignored (the red amplitude bars in the
amplitude plot).
amplitude values around the median value, is the amplitudes of the same t(0) time (the red
incorporated in the stacking process. squares on the NMO corrected CDP in
Fig. 10.20 schematically shows the median Fig. 10.20) are stacked, they are simply sorted in
value of the amplitudes with a certain t(0) zero ascending order and the central value is selected
offset time in a CDP gather. Normally, a classical as the stacked amplitude value for that t(0) time,
median stack does not sum the samples: before while remaining amplitudes are ignored. For the