
Page 482 - Acquisition and Processing of Marine Seismic Data
P. 482
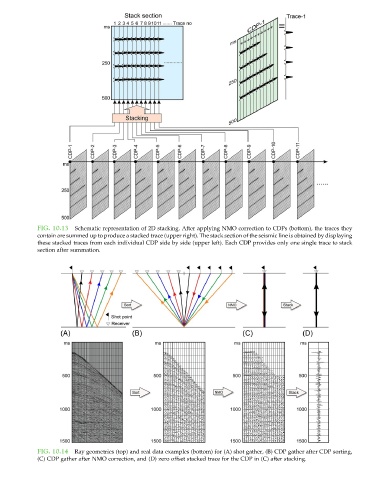
FIG. 10.13  Schematic representation of 2D stacking. After applying NMO correction to CDPs (bottom), the traces they
           contain are summed up to produce a stacked trace (upper right). The stack section of the seismic line is obtained by displaying
           these stacked traces from each individual CDP side by side (upper left). Each CDP provides only one single trace to stack
           section after summation.


           FIG. 10.14  Ray geometries (top) and real data examples (bottom) for (A) shot gather, (B) CDP gather after CDP sorting,
           (C) CDP gather after NMO correction, and (D) zero offset stacked trace for the CDP in (C) after stacking.