
Page 542 - Acquisition and Processing of Marine Seismic Data
P. 542
11.11 WHICH MIGRATION TO USE? 533
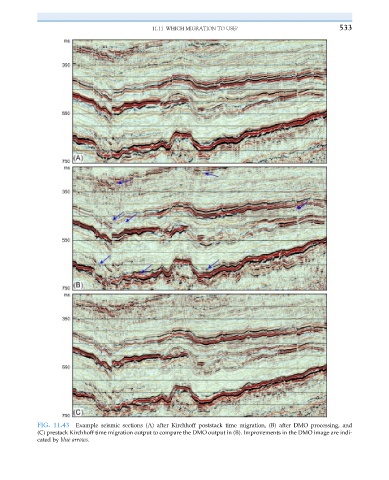
FIG. 11.43 Example seismic sections (A) after Kirchhoff poststack time migration, (B) after DMO processing, and
(C) prestack Kirchhoff time migration output to compare the DMO output in (B). Improvements in the DMO image are indi-
cated by blue arrows.