
Page 537 - Acquisition and Processing of Marine Seismic Data
P. 537
528 11. SEISMIC MIGRATION
obtain a distorted image of the subsurface using plane, which moves the event along the orange
our 2D seismic data. Even though we cannot semicircular curve in Fig. 11.37C, where the
solve any structures at some crossline offset to amount of displacement (x) is indicated by
the survey line with 2D datasets (e.g., the one crossline displacement. This ambiguity can only
at x distance away from the sail line in be solved by recording 3D data and applying 3D
Fig. 11.37B), they sometimes have strong influ- imaging.
ences on the data. Out-of-plane reflections can As a result, 2D lines frequently involve side-
only be properly focused after 3D migration. sweeps as steep linear or curved reflections as
The out-of-plane reflections are recorded as if well as noncollapsed diffraction hyperbolas, even
they are reflected from the 2D sail line plane at after 2D migration (Fig. 11.37D). 3D migration
the time they arrive at the receivers (green dot revokes the assumption of 2D migration that
in Fig. 11.37C), and during 2D migration, these "all recorded data is reflected from the survey line
amplitudes are treated as ordinary 2D reflec- plane," and it displaces the events to their true
tions recorded from directly beneath the seismic subsurface locations in both inline and crossline
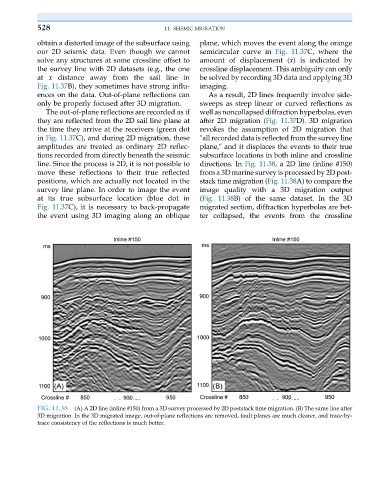
line. Since the process is 2D, it is not possible to directions. In Fig. 11.38, a 2D line (inline #150)
move these reflections to their true reflected from a 3D marine survey is processed by 2D post-
positions, which are actually not located in the stack time migration (Fig. 11.38A) to compare the
survey line plane. In order to image the event image quality with a 3D migration output
at its true subsurface location (blue dot in (Fig. 11.38B) of the same dataset. In the 3D
Fig. 11.37C), it is necessary to back-propagate migrated section, diffraction hyperbolas are bet-
the event using 3D imaging along an oblique ter collapsed, the events from the crossline
FIG. 11.38 (A) A 2D line (inline #150) from a 3D survey processed by 2D poststack time migration. (B) The same line after
3D migration. In the 3D migrated image, out-of-plane reflections are removed, fault planes are much clearer, and trace-by-
trace consistency of the reflections is much better.