
Page 120 - Adsorbents fundamentals and applications
P. 120
ACTIVATED CARBON FIBERS 105
Table 5.8. Pore sizes of ACF determined by N 2 and He adsorption
Cellulose-Based Pitch-Based PAN-Based
N 2 BET Surface Area 1147 795 743
3
Micropore Vol. (cm /g) 0.58 0.37 0.35
Pore Size ( ˚ A) 10.1 9.4 9.5
3
He Narrow Pore Vol. (cm /g) 0.54 0.42 0.32
3
Wide Pore Vol. (cm /g) 0.04 0 0.01
Pore Size ( ˚ A) 9.3 7.6 8.9
Kaneko et al. 1994.
content because their precursors (polymers and pitches) are ash-free. As discussed
above, any minerals would act as catalyst particles during activation, and these
particles are known to undergo channeling, tunneling, and edge recession actions
during the carbon gasification process (Baker, 1986; Yang 1984; Goethel and
Yang, 1989). These catalytic actions create large pores. During gas activation of
the carbon fibers, the pores are elongated but not widened. The basic reason is
the graphitic structure of the carbon fiber. The carbon atoms on the basal plane of
graphite are not active and are not gasified, whereas the edge atoms are the active
sites for gasification (Yang, 1984). Moreover, the reactivities of the edge atoms
are anisotropic, that is, the zigzag edges are more active than the armchair edge
sites (Yang, 1984; Yang and Duan, 1985). The real edges of the graphite planes
are a combination of different crystalline edge sites, with different reactivities.
The inter-plane spacing in graphite is 3.35 ˚ A. Once gasification is initiated on an
edge site, the gasification will continue on neighboring edge sites along the same
graphite (or graphene) sheet. Hence the pore is elongated within two graphite
sheets, with a pore dimension of approximately 7 ˚ A. If gasification is initiated
on edge atoms of two adjacent sheets, the pores will be confined to within two
graphite sheets ∼10 ˚ A apart. Consequently most of the pores in ACFs are 10 ˚ A
in size. To produce larger pores and a distribution of pore sizes, catalysts must
be added before gas activation. This was shown is a series of publications by
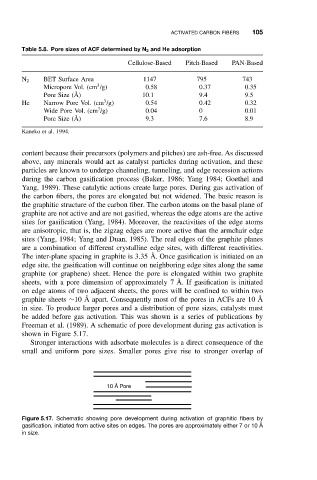
Freeman et al. (1989). A schematic of pore development during gas activation is
shown in Figure 5.17.
Stronger interactions with adsorbate molecules is a direct consequence of the
small and uniform pore sizes. Smaller pores give rise to stronger overlap of
10 Å Pore
Figure 5.17. Schematic showing pore development during activation of graphitic fibers by
gasification, initiated from active sites on edges. The pores are approximately either 7 or 10 ˚ A
in size.