
Page 383 - Adsorbents fundamentals and applications
P. 383
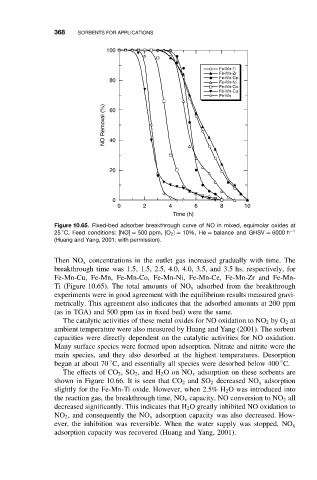
368   SORBENTS FOR APPLICATIONS

                                   100

                                                                   Fe-Mn-Ti
                                                                   Fe-Mn-Zr
                                                                   Fe-Mn-Ce
                                    80                             Fe-Mn-Ni
                                                                   Fe-Mn-Co
                                                                   Fe-Mn-Cu
                                                                   Fe-Mn
                                   NO Removal (%)  40
                                    60


                                    20


                                     0
                                      0      2       4      6      8      10
                                                      Time (h)
                     Figure 10.65. Fixed-bed adsorber breakthrough curve of NO in mixed, equimolar oxides at
                       ◦
                     25 C. Feed conditions: [NO] = 500 ppm, [O 2 ] = 10%, He = balance and GHSV = 6000 h −1
                     (Huang and Yang, 2001; with permission).

                     Then NO x concentrations in the outlet gas increased gradually with time. The
                     breakthrough time was 1.5, 1.5, 2.5, 4.0, 4.0, 3.5, and 3.5 hs, respectively, for
                     Fe-Mn-Cu, Fe-Mn, Fe-Mn-Co, Fe-Mn-Ni, Fe-Mn-Ce, Fe-Mn-Zr and Fe-Mn-
                     Ti (Figure 10.65). The total amounts of NO x adsorbed from the breakthrough
                     experiments were in good agreement with the equilibrium results measured gravi-
                     metrically. This agreement also indicates that the adsorbed amounts at 200 ppm
                     (as in TGA) and 500 ppm (as in fixed bed) were the same.
                       The catalytic activities of these metal oxides for NO oxidation to NO 2 by O 2 at
                     ambient temperature were also measured by Huang and Yang (2001). The sorbent
                     capacities were directly dependent on the catalytic activities for NO oxidation.
                     Many surface species were formed upon adsorption. Nitrate and nitrite were the
                     main species, and they also desorbed at the highest temperatures. Desorption
                                    ◦
                                                                                   ◦
                     began at about 70 C, and essentially all species were desorbed below 400 C.
                       The effects of CO 2 ,SO 2 ,and H 2 OonNO x adsorption on these sorbents are
                     shown in Figure 10.66. It is seen that CO 2 and SO 2 decreased NO x adsorption
                     slightly for the Fe-Mn-Ti oxide. However, when 2.5% H 2 O was introduced into
                     the reaction gas, the breakthrough time, NO x capacity, NO conversion to NO 2 all
                     decreased significantly. This indicates that H 2 O greatly inhibited NO oxidation to
                     NO 2 , and consequently the NO x adsorption capacity was also decreased. How-
                     ever, the inhibition was reversible. When the water supply was stopped, NO x
                     adsorption capacity was recovered (Huang and Yang, 2001).