
Page 56 - Adsorption Technology & Design, Elsevier (1998)
P. 56
Fundamentals of adsorption equilibria 53
ql C1CT
~ = (3.33)
Q'r K12 4- (1- K12)(cl/CT)
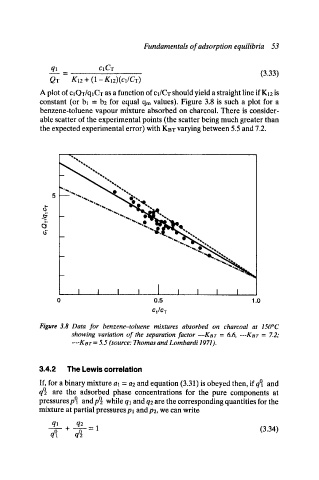
A plot of cl QT/qlCT as a function of cl/CT should yield a straight line if KI2 is
constant (or bl = bE for equal qm values). Figure 3.8 is such a plot for a
benzene-toluene vapour mixture absorbed on charcoal. There is consider-
able scatter of the experimental points (the scatter being much greater than
the expected experimental error) with KBT varying between 5.5 and 7.2.
r
I
I .... I I I I I I I
o 0.5 1.0
Cl/C T
Figure 3.8 Data for benzene-toluene mixtures absorbed on charcoal at 150~
showing variation of the separation factor--Kar = 6.6, ---KBT = Z2;
.... KBT = 5.5 (source: Thomas and Lombardi 1971).
3.4.2 The Lewis correlation
If, for a binary mixture al = a2 and equation (3.31) is obeyed then, if q~ and
qO are the adsorbed phase concentrations for the pure components at
pressures pO and pO while ql and q2 are the corresponding quantities for the
mixture at partial pressures pl and p2, we can write
ql q2 = 1 (3.34)
q-V + qW