Page 125 - Adsorption, Ion Exchange & Catalysis- 2007, Elsevier - Copy
P. 125

Else_AIEC-INGLE_cH003.qxd  7/13/2006  1:45 PM  Page 121
                  3.4 Slurry Reactors                                     121


                  in this correlation, the solid density is used. F it is equal to the par- or nonporous particles,
                  ticle density. However, for porous solids, it is more appropriate to use the hydraulic density
                  as defined in Section 3.9.6.
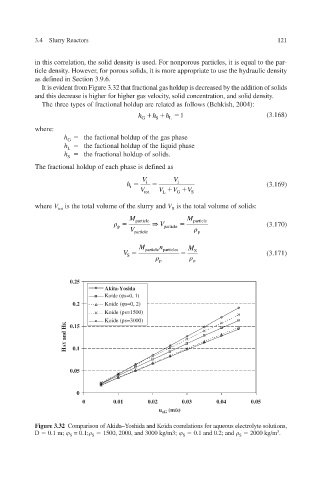
                    It is evident from Figure 3.32 that fractional gas holdup is decreased by the addition of solids
                  and this decrease is higher for higher gas velocity, solid concentration, and solid density.
                    The three types of fractional holdup are related as follo 2004): ws (Behkish,
                                                h  G  h    S  h  L  1               (3.168)
                  where:
                          h  G    the factional holdup of the gas phase
                          h  L    the factional holdup of the liquid phase
                          h  S    the fractional holdup of solids.
                  The fractional holdup of each phase is defined as
                                                 V        V
                                            h     i        i                        (3.169)
                                             i
                                                V    V  V    V
                                                 tot   L  G  S
                  where   V  tot  is the total volume of the slurry and   V  S  is the total volume of solids:
                                             M  particle     M  particle
                                                      V                             (3.170)
                                          p            particle
                                             V
                                              particle           p
                                                M  particle pa le tic r s  n  M
                                           V                   S                    (3.171)
                                            S

                                                      p        p
                            0.25
                                      Akita-Yosida
                                      Koide (  ϕs=0, 1)
                             0.2      Koide (  ϕ s=0, 2)
                                      Koide (  ρ s=1500)
                                      Koide (  ρ s=3000)
                            0.15
                           K
                            and H
                             0.1
                           AY
                           H
                            0.05


                              0
                                0       0.01   0.02   0.03   0.04   0.05
                                                     u  sG   (m/s)

                  Figure 3.32  Comparison of Akida–Yoshida and Koida correlations for aqueous electrolyte solutions,
                  D    0.1 m;     = 0.1;      1500, 2000, and 3000 kg/m3;       0.1 and 0.2; and       2000 kg/m  3  .
                                                                            S
                                                            S
                            S
                                  S
   120   121   122   123   124   125   126   127   128   129   130