Page 825 - Advanced_Engineering_Mathematics o'neil
P. 825

Answers to Selected Problems  805


                                          5
                                                                                  5
                                          4
                                                                                  4
                                          3
                                                                                  3

                                          2
                                                                                  2
                                          1                                       1

                                                                                  0
                                          0
                                                                                    0     1     2     3      4     5
                                           0     2     4     6     8    10                         t
                                                          t                      –1
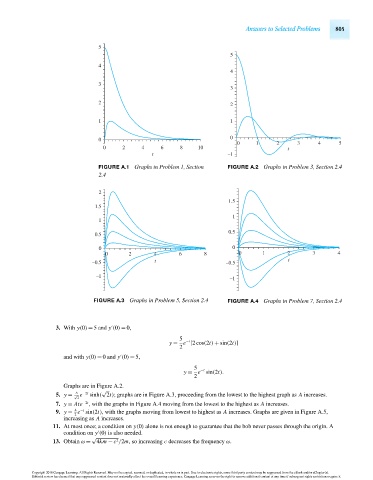
                                          FIGURE A.1 Graphs in Problem 1, Section  FIGURE A.2 Graphs in Problem 3, Section 2.4
                                          2.4


                                          2
                                                                                 1.5
                                         1.5
                                                                                   1
                                          1
                                                                                 0.5
                                         0.5
                                          0                                        0
                                            0      2       4      6       8         0       1      2       3      4
                                        –0.5               t                     –0.5              t

                                         –1
                                                                                  –1

                                        FIGURE A.3 Graphs in Problem 5, Section 2.4  FIGURE A.4 Graphs in Problem 7, Section 2.4


                             3. With y(0) = 5and y (0) = 0,

                                                                  5
                                                                    −t
                                                               y = e [2cos(2t) + sin(2t)]
                                                                  2

                               and with y(0) = 0and y (0) = 5,
                                                                       5
                                                                         −t
                                                                    y = e sin(2t).
                                                                       2
                               Graphs are in Figure A.2.
                                           √
                                   A
                             5. y = √ e  −2t  sinh( 2t); graphs are in Figure A.3, proceeding from the lowest to the highest graph as A increases.
                                   2
                             7. y = Ate −2t , with the graphs in Figure A.4 moving from the lowest to the highest as A increases.
                                  A −t
                             9. y = e sin(2t), with the graphs moving from lowest to highest as A increases. Graphs are given in Figure A.5,
                                   2
                               increasing as A increases.
                            11. At most once; a condition on y(0) alone is not enough to guarantee that the bob never passes through the origin. A

                               condition on y (0) is also needed.
                                        √
                                               2
                            13. Obtain ω =  4km − c /2m, so increasing c decreases the frequency ω.
                      Copyright 2010 Cengage Learning. All Rights Reserved. May not be copied, scanned, or duplicated, in whole or in part. Due to electronic rights, some third party content may be suppressed from the eBook and/or eChapter(s).
                      Editorial review has deemed that any suppressed content does not materially affect the overall learning experience. Cengage Learning reserves the right to remove additional content at any time if subsequent rights restrictions require it.
                                   October 14, 2010  17:50  THM/NEIL    Page-805        27410_25_Ans_p801-866
   820   821   822   823   824   825   826   827   828   829   830