
Page 59 - Advanced Organic Chemistry Part A - Structure and Mechanisms, 5th ed (2007) - Carey _ Sundberg
P. 59
38
CHAPTER 1
Chemical Bonding
and Molecular Structure z
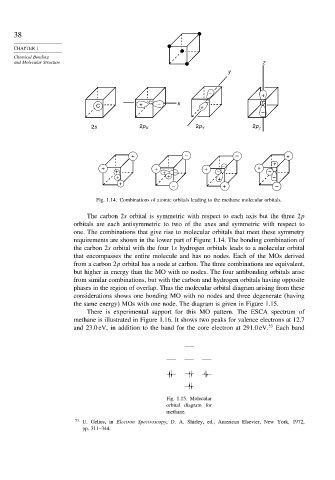
y
– +
C + C – x + C C
–
2s 2p X 2p Y 2p z
+ – – +
– +
+ + + +
+ + – – –
+ + + –
+
– + –
Fig. 1.14. Combinations of atomic orbitals leading to the methane molecular orbitals.
The carbon 2s orbital is symmetric with respect to each axis but the three 2p
orbitals are each antisymmetric to two of the axes and symmetric with respect to
one. The combinations that give rise to molecular orbitals that meet these symmetry
requirements are shown in the lower part of Figure 1.14. The bonding combination of
the carbon 2s orbital with the four 1s hydrogen orbitals leads to a molecular orbital
that encompasses the entire molecule and has no nodes. Each of the MOs derived
from a carbon 2p orbital has a node at carbon. The three combinations are equivalent,
but higher in energy than the MO with no nodes. The four antibonding orbitals arise
from similar combinations, but with the carbon and hydrogen orbitals having opposite
phases in the region of overlap. Thus the molecular orbital diagram arising from these
considerations shows one bonding MO with no nodes and three degenerate (having
the same energy) MOs with one node. The diagram is given in Figure 1.15.
There is experimental support for this MO pattern. The ESCA spectrum of
methane is illustrated in Figure 1.16. It shows two peaks for valence electrons at 12.7
and 23.0 eV, in addition to the band for the core electron at 291.0 eV. 53 Each band
Fig. 1.15. Molecular
orbital diagram for
methane.
53
U. Gelius, in Electron Spectroscopy, D. A. Shirley, ed., American Elsevier, New York, 1972,
pp. 311–344.