
Page 280 - Advanced Thermodynamics for Engineers, Second Edition
P. 280
12.8 THE VAN’T HOFF RELATIONSHIP 269
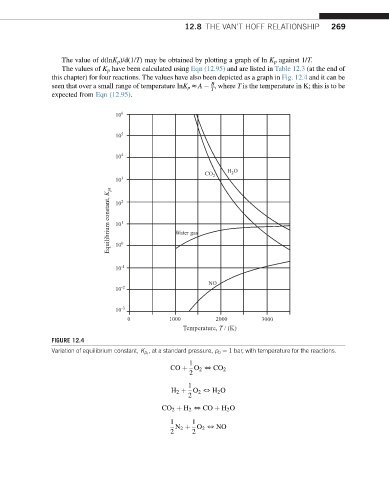
The value of d(lnK p )/d(1/T) may be obtained by plotting a graph of ln K p against 1/T.
The values of K p have been calculated using Eqn (12.95) and are listed in Table 12.3 (at the end of
this chapter) for four reactions. The values have also been depicted as a graph in Fig. 12.4 and it can be
B
seen that over a small range of temperature lnK p zA , where T is the temperature in K; this is to be
T
expected from Eqn (12.95).
10 6
10 5
10 4
H O
CO 2 2
10 3
Equilibrium constant, K pr 10 2 1 0 Water gas
10
10
10 -1
NO
10 -2
10 -3
0 1000 2000 3000
Temperature, T / (K)
FIGURE 12.4
, at a standard pressure, p 0 ¼ 1 bar, with temperature for the reactions.
Variation of equilibrium constant, K p r
1
CO þ O 2 5 CO 2
2
1
H 2 þ O 2 5 H 2 O
2
CO 2 þ H 2 5 CO þ H 2 O
1 1
N 2 þ O 2 5 NO
2 2