
Page 435 - Advanced thermodynamics for engineers
P. 435
18.1 LIQUEFACTION BY COOLING – METHOD (I) 425
between the top and bottom temperatures is related to the difference between the pressures. To achieve
a low temperature, it is necessary to reduce the evaporator pressure, and this will increase the specific
volume of the working fluid and hence the size of the evaporator. The large temperature difference will
also decrease the coefficient of performance of the plant. The use of two plants in cascade enables the
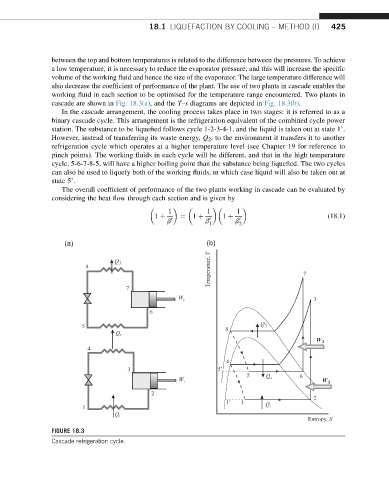
working fluid in each section to be optimised for the temperature range encountered. Two plants in
cascade are shown in Fig. 18.3(a), and the T–s diagrams are depicted in Fig. 18.3(b).
In the cascade arrangement, the cooling process takes place in two stages: it is referred to as a
binary cascade cycle. This arrangement is the refrigeration equivalent of the combined cycle power
station. The substance to be liquefied follows cycle 1-2-3-4-1, and the liquid is taken out at state 1’.
However, instead of transferring its waste energy, Q 2 , to the environment it transfers it to another
refrigeration cycle which operates at a higher temperature level (see Chapter 19 for reference to
pinch points). The working fluids in each cycle will be different, and that in the high temperature
cycle, 5-6-7-8-5, will have a higher boiling point than the substance being liquefied. The two cycles
canalsobeusedtoliquefy both ofthe workingfluids, inwhich case liquidwill also be takenout at
state 5’.
The overall coefficient of performance of the two plants working in cascade can be evaluated by
considering the heat flow through each section and is given by
1 1 1
1 þ ¼ 1 þ 1 þ (18.1)
b 0 b 0 1 b 0 2
(a) (b)
Temperature, T 7
Q 3
8
7
W 3
6
5 8 Q 3
Q
W 2
4
4
3 5'
5 Q 6
W W 1
2
2
1' 1 Q
1
Q
Entropy, S
FIGURE 18.3
Cascade refrigeration cycle.