
Page 440 - Advanced thermodynamics for engineers
P. 440
430 CHAPTER 18 LIQUEFACTION OF GASES
Temperature, T
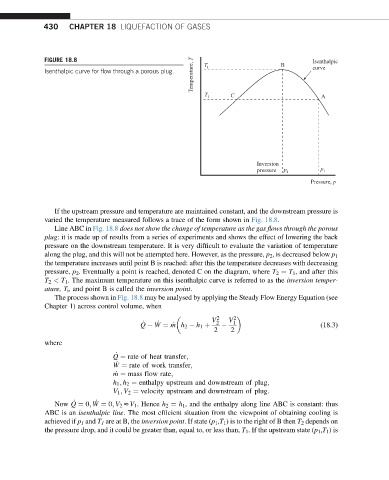
FIGURE 18.8 T i B Isenthalpic
Isenthalpic curve for flow through a porous plug. curve
T 1 C A
Inversion
pressure p i p 1
Pressure, p
If the upstream pressure and temperature are maintained constant, and the downstream pressure is
varied the temperature measured follows a trace of the form shown in Fig. 18.8.
Line ABC in Fig. 18.8 does not show the change of temperature as the gas flows through the porous
plug: it is made up of results from a series of experiments and shows the effect of lowering the back
pressure on the downstream temperature. It is very difficult to evaluate the variation of temperature
along the plug, and this will not be attempted here. However, as the pressure, p 2 , is decreased below p 1
the temperature increases until point B is reached: after this the temperature decreases with decreasing
pressure, p 2 . Eventually a point is reached, denoted C on the diagram, where T 2 ¼ T 1 , and after this
T 2 < T 1 . The maximum temperature on this isenthalpic curve is referred to as the inversion temper-
ature, T i , and point B is called the inversion point.
The process shown in Fig. 18.8 may be analysed by applying the Steady Flow Energy Equation (see
Chapter 1) across control volume, when
2 2
_ _ V 2 V 1
Q W ¼ _ m h 2 h 1 þ (18.3)
2 2
where
_
Q ¼ rate of heat transfer;
_
W ¼ rate of work transfer;
_ m ¼ mass flow rate;
h 1 ; h 2 ¼ enthalpy upstream and downstream of plug;
V 1 ; V 2 ¼ velocity upstream and downstream of plug:
_
_
Now Q ¼ 0; W ¼ 0; V 2 zV 1 . Hence h 2 ¼ h 1 , and the enthalpy along line ABC is constant: thus
ABC is an isenthalpic line. The most efficient situation from the viewpoint of obtaining cooling is
achieved if p 1 and T 1 are at B, the inversion point. If state (p 1 ,T 1 ) is to the right of B then T 2 depends on
the pressure drop, and it could be greater than, equal to, or less than, T 1 . If the upstream state (p 1 ,T 1 )is