
Page 459 - Advanced thermodynamics for engineers
P. 459
450 CHAPTER 19 PINCH TECHNOLOGY
Hot streams
310 245 280
3 5 7 Steam
1 95 H H 316.8 MJ/h 205
Cold streams 2 40 H 408.7 MJ/h 205
518.4 MJ/h
220
150
4
H
6 65 H 354.0 MJ/h 140
Cold water C C C
449.4 426.0 511.7
MJ/h MJ/h MJ/h
205 95 65
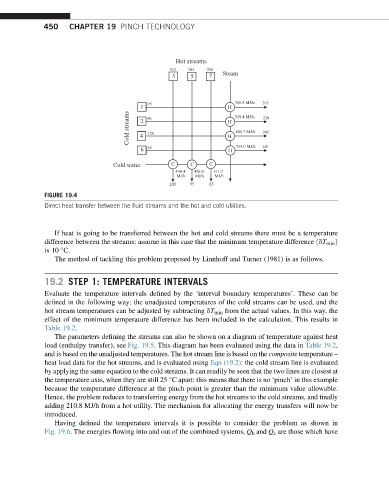
FIGURE 19.4
Direct heat transfer between the fluid streams and the hot and cold utilities.
If heat is going to be transferred between the hot and cold streams there must be a temperature
difference between the streams: assume in this case that the minimum temperature difference ðdT min Þ
is 10 C.
The method of tackling this problem proposed by Linnhoff and Turner (1981) is as follows.
19.2 STEP 1: TEMPERATURE INTERVALS
Evaluate the temperature intervals defined by the ‘interval boundary temperatures’. These can be
defined in the following way: the unadjusted temperatures of the cold streams can be used, and the
hot stream temperatures can be adjusted by subtracting dT min from the actual values. In this way, the
effect of the minimum temperature difference has been included in the calculation. This results in
Table 19.2.
The parameters defining the streams can also be shown on a diagram of temperature against heat
load (enthalpy transfer), see Fig. 19.5. This diagram has been evaluated using the data in Table 19.2,
and is based on the unadjusted temperatures. The hot stream line is based on the composite temperature –
heat load data for the hot streams, and is evaluated using Eqn (19.2): the cold stream line is evaluated
by applying the same equation to the cold streams. It can readily be seen that the two lines are closest at
the temperature axis, when they are still 25 C apart: this means that there is no ‘pinch’ in this example
because the temperature difference at the pinch point is greater than the minimum value allowable.
Hence, the problem reduces to transferring energy from the hot streams to the cold streams, and finally
adding 210.8 MJ/h from a hot utility. The mechanism for allocating the energy transfers will now be
introduced.
Having defined the temperature intervals it is possible to consider the problem as shown in
Fig. 19.6. The energies flowing into and out of the combined systems, Q h and Q c are those which have