
Page 463 - Advanced thermodynamics for engineers
P. 463
454 CHAPTER 19 PINCH TECHNOLOGY
Streams mC T mC T
300
Q
1 3 128.4
270
Q 128.4
2 3,7 233.1
235
Q 361.5
3 3,7,5 142.5
220
Q 504.0
4 3,7,5,2 99.3
205
Q 3,7,5, 603.3
5 -36.9
195 2,1,4
Q 566.4
6 7,5,2, -358.7
150 1,4
Q 207.8
7,5,2,
7 -5.4
140 1
Q 202.4 Heating 210.8
8 7,5,2, -236.8
95 1,6
Q -34.4 176.4
9 7,5,2, -23.8
85 6
Q -58.2 152.6
10 7,6,2 -104.4
65
Q -162.5 48.2
11 7,2 -5.0
55
Q -167.5 43.2
12 2 -43.2
40
Q -210.8 0
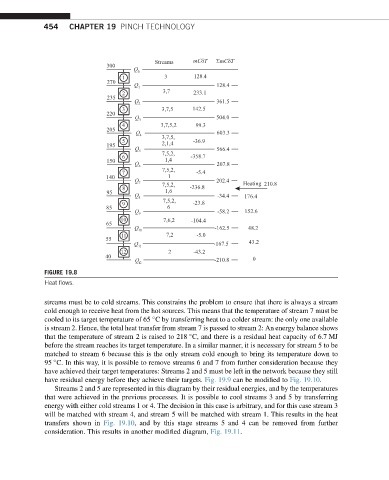
FIGURE 19.8
Heat flows.
streams must be to cold streams. This constrains the problem to ensure that there is always a stream
cold enough to receive heat from the hot sources. This means that the temperature of stream 7 must be
cooled to its target temperature of 65 C by transferring heat to a colder stream: the only one available
is stream 2. Hence, the total heat transfer from stream 7 is passed to stream 2: An energy balance shows
that the temperature of stream 2 is raised to 218 C, and there is a residual heat capacity of 6.7 MJ
before the stream reaches its target temperature. In a similar manner, it is necessary for stream 5 to be
matched to stream 6 because this is the only stream cold enough to bring its temperature down to
95 C. In this way, it is possible to remove streams 6 and 7 from further consideration because they
have achieved their target temperatures: Streams 2 and 5 must be left in the network because they still
have residual energy before they achieve their targets. Fig. 19.9 can be modified to Fig. 19.10.
Streams 2 and 5 are represented in this diagram by their residual energies, and by the temperatures
that were achieved in the previous processes. It is possible to cool streams 3 and 5 by transferring
energy with either cold streams 1 or 4. The decision in this case is arbitrary, and for this case stream 3
will be matched with stream 4, and stream 5 will be matched with stream 1. This results in the heat
transfers shown in Fig. 19.10, and by this stage streams 5 and 4 can be removed from further
consideration. This results in another modified diagram, Fig. 19.11.