
Page 468 - Advanced thermodynamics for engineers
P. 468
19.5 STEP 3: HEAT CASCADING 459
140
12.5 MJ/h
120
Temperature / C Pinch Cold stream
o 100 Hot stream
80
5C Basic cold stream
Modified cold stream
60
17.5
30
40
0 50 100 150 200 250 300
Heat load / MJ/h
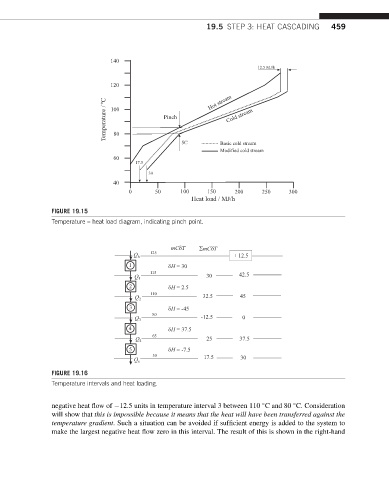
FIGURE 19.15
Temperature – heat load diagram, indicating pinch point.
mC T mC T
125
Q h + 12.5
1 H = 30
115
Q 1 30 42.5
2 H = 2.5
110
Q 2 32.5 45
3 H = -45
80 -12.5
Q 3 0
4 H = 37.5
65
Q 4 25 37.5
5 H = -7.5
50 17.5
Q c 30
FIGURE 19.16
Temperature intervals and heat loading.
negative heat flow of 12.5 units in temperature interval 3 between 110 C and 80 C. Consideration
will show that this is impossible because it means that the heat will have been transferred against the
temperature gradient. Such a situation can be avoided if sufficient energy is added to the system to
make the largest negative heat flow zero in this interval. The result of this is shown in the right-hand