
Page 472 - Advanced thermodynamics for engineers
P. 472
19.6 PROBLEMS 463
Table P19.1 Data Related to P19.1
Supply Temperature Target Temperature Heat Flow Capacity
Stream No Stream Type T S /( C) T T /( C) mC/(MJ/hK)
1 Hot 205 65 2.0
2 Hot 175 75 4.0
3 Cold 45 180 3.0
4 Cold 105 155 4.5
P19.2 Some stream data have been collected from a process plant, and these are listed in Table
P19.2. Assuming the minimum temperature difference between streams, DT min ¼ 10 C
(a) calculate the data missing from Table P19.2;
(b) analyse this data to determine the minimum heat supplied from the hot utility, the
minimum heat transferred to the cold utility, and the pinch temperatures;
(c) draw a schematic diagram of the heat transfer network.
Table P19.2 Data Related to P19.2
Supply Target Enthalpy Heat Flow
Temperature Temperature Change, Capacity
Stream No Stream Type T S /( C) T T /( C) DH/(kW) mC/(kW/K)
1 Cold 60 180 ? 3
2 Hot 180 40 ? 2
3 Cold 30 130 220 ?
4 Hot 150 40 440 ?
5 Cold 60 80 40 ?
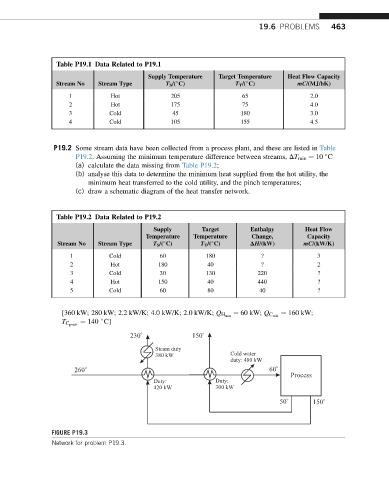
¼ 160 kW;
[360 kW; 280 kW; 2.2 kW/K; 4.0 kW/K; 2.0 kW/K; Q H min ¼ 60 kW; Q C min
+
¼ 140 C]
T C pinch
230 o 150 o
Steam duty
380 kW Cold water
duty: 480 kW
260 o 60 o
Process
Duty: Duty:
420 kW 300 kW
o o
50 150
FIGURE P19.3
Network for problem P19.3.