
Page 467 - Advanced thermodynamics for engineers
P. 467
458 CHAPTER 19 PINCH TECHNOLOGY
Table 19.4 Definition of Temperature Intervals
Stream No Stream Type T S /( C) T T /( C) Adjusted Temperatures Order
1 Cold 50 50 T 6
110 110 T 3
2 Hot 130 125 T 1
70 65 T 5
3 Cold 80 80 T 4
115 115 T 2
4 Hot 120 115 Duplicate
55 50 Duplicate
125
Q
Q h 1
115
Q
T
2
T 110
Q
T
3 Temperatures ( C)
T 4 80
T Q
T 4
Q 65
5
Q c 50
Q
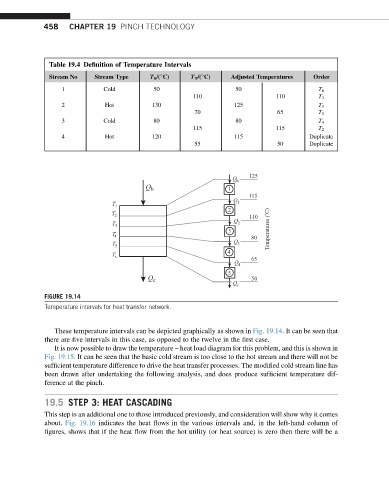
FIGURE 19.14
Temperature intervals for heat transfer network.
These temperature intervals can be depicted graphically as shown in Fig. 19.14. It can be seen that
there are five intervals in this case, as opposed to the twelve in the first case.
It is now possible to draw the temperature – heat load diagram for this problem, and this is shown in
Fig. 19.15. It can be seen that the basic cold stream is too close to the hot stream and there will not be
sufficient temperature difference to drive the heat transfer processes. The modified cold stream line has
been drawn after undertaking the following analysis, and does produce sufficient temperature dif-
ference at the pinch.
19.5 STEP 3: HEAT CASCADING
This step is an additional one to those introduced previously, and consideration will show why it comes
about. Fig. 19.16 indicates the heat flows in the various intervals and, in the left-hand column of
figures, shows that if the heat flow from the hot utility (or heat source) is zero then there will be a